Hypoxia-induced microRNA-424 expression in human endothelial cells regulates HIF-α isoforms and promotes angiogenesis - PubMed (original) (raw)
. 2010 Nov;120(11):4141-54.
doi: 10.1172/JCI42980. Epub 2010 Oct 25.
Affiliations
- PMID: 20972335
- PMCID: PMC2964978
- DOI: 10.1172/JCI42980
Hypoxia-induced microRNA-424 expression in human endothelial cells regulates HIF-α isoforms and promotes angiogenesis
Goutam Ghosh et al. J Clin Invest. 2010 Nov.
Abstract
Adaptive changes to oxygen availability are critical for cell survival and tissue homeostasis. Prolonged oxygen deprivation due to reduced blood flow to cardiac or peripheral tissues can lead to myocardial infarction and peripheral vascular disease, respectively. Mammalian cells respond to hypoxia by modulating oxygen-sensing transducers that stabilize the transcription factor hypoxia-inducible factor 1α (HIF-1α), which transactivates genes governing angiogenesis and metabolic pathways. Oxygen-dependent changes in HIF-1α levels are regulated by proline hydroxylation and proteasomal degradation. Here we provide evidence for what we believe is a novel mechanism regulating HIF-1α levels in isolated human ECs during hypoxia. Hypoxia differentially increased microRNA-424 (miR-424) levels in ECs. miR-424 targeted cullin 2 (CUL2), a scaffolding protein critical to the assembly of the ubiquitin ligase system, thereby stabilizing HIF-α isoforms. Hypoxia-induced miR-424 was regulated by PU.1-dependent transactivation. PU.1 levels were increased in hypoxic endothelium by RUNX-1 and C/EBPα. Furthermore, miR-424 promoted angiogenesis in vitro and in mice, which was blocked by a specific morpholino. The rodent homolog of human miR-424, mu-miR-322, was significantly upregulated in parallel with HIF-1α in experimental models of ischemia. These results suggest that miR-322/424 plays an important physiological role in post-ischemic vascular remodeling and angiogenesis.
Figures
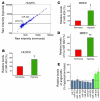
Figure 1. Hypoxia induces upregulation of miR-424 in ECs.
(A) Representative miRNA array data showing relative expression levels of miRNA in HUVECs. Data show raw intensities of individual miRNA under normoxia and hypoxia after 24 hours. (B–D) Hypoxia-induced changes in miR-424/322 were validated by q-PCR. (B) HUVECs, (C) human BOECs, (D) and MBECs. n = 3. *P < 0.05; **P < 0.02. (E) Relative changes in angiomiRs in HUVECs during hypoxia from miRNA array. n = 4. Values represent mean ± SD.
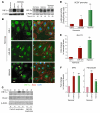
Figure 2. miR-424 stabilizes HIF-1α and HIF-2α and increases transcription of HIF-1α/HIF-2α target genes.
(A) Top: Western blot of HIF-1α in the whole-cell lysates of HUVECs. Normoxia (N; lane 1) and hypoxia (H; lane 2) after 24 hours, and miR-control (lane 3) and miR-424 under normoxia (lane 4) after 48 hours. Bottom: Western blot of HIF-2α. miR-c, miR-control. (B) Cellular distribution of HIF-1α in HUVECs transfected with either miR-control or miR-424 under normoxia. HUVECs exposed to hypoxia were used as a positive control. Arrowheads indicate nuclear accumulation of HIF-1α. Scale bar: 10 μm. (C) Western blot of HIF-1α and CUL2 in HUVECs after knockdown of miR-424 under hypoxia. HUVECs treated with control morpholino under normoxia (lanes 1 and 2), hypoxia (lanes 3 and 4), and miR-424–specific morpholino under hypoxia (lanes 5 and 6) are shown. (D) HUVECs were cotransfected with either miR-control or miR-424 and a VEGF-luciferase reporter construct under normoxia, or were transfected only with reporter construct and maintained under hypoxia (24 hours). Renilla luciferase levels were used as an internal control. (E and F) HUVECs were transfected with either an miR-control or miR-424 construct and maintained under normoxia. GLUT1, EPO, and fibronectin transcript levels were determined by q-PCR. Values represent mean ± SD. n = 3. *P ≤ 0.05; **P ≤ 0.02.
Figure 3. CUL2 is a functional target for miR-424.
(A) Microarray data of miRNA expression levels from 4 independent primary cultures of HUVECs were analyzed. Data show relative levels of 37 miRNAs targeting the CUL2 3′UTR under hypoxia. Normoxic levels are considered to be equal to 100%. (B) Western blots showing the expression of CUL2 in the whole-cell lysates from HUVECs under normoxia (lanes 1 and 2) or hypoxia (lanes 3 and 4), miR-control HUVECs under normoxia (lane 5), and miR-424–transfected HUVECs under normoxia (lanes 6 and 7). β-Actin was used as loading control. (C) Schematic diagram of luciferase reporter construct containing the CUL2 3′UTR. (D) Luciferase activity (mean ± SD) in HUVECs cotransfected with the reporter construct of CUL2 3′UTR, miR-424. Renilla luciferase was used as an internal control. (E) Luciferase activity (mean ± SD) using a reporter construct containing the 3′UTR of CUL2 (wild-type or mutant lacking the miR-424 target site) under normoxia and hypoxia are shown. (F) Western blot showing the changes in VHL in the whole-cell lysates of HUVECs expressing miR-control (lanes 1 and 4), miR-210 (lanes 2 and 3), and miR-424 (lanes 5 and 6). β-Actin was used as loading control. Values represent mean ± SD. *P < 0.05.
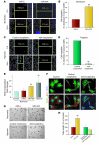
Figure 4. Effect of miR-424 on in vitro angiogenesis.
(A and C) The effects of miR-424 overexpression under normoxia and silencing by miR-424–morpholino under hypoxia on EC migration were determined by scratch wound assay. Wound closure was determined after 24 hours. Yellow and green lines indicate edges of scratch wounds. Representative photomicrographs are shown. Migration of miR-424–overexpressing cells under normoxia (A). Migration of miR-424–morpholino–treated cells under hypoxia (C). (B and D) Quantification of cell migration. (B) Normoxia (miR-control or miR-424 overexpression). (D) Hypoxia (control morpholino or miR-424–morpholino). n = 3. (E) Effect of miR-424 on cell proliferation. BrdU incorporation was determined by ELISA. Values represent mean ± SD. n = 3. (F) Representative confocal images of HUVECs stained for the proliferation marker PCNA. HUVEC cultures were transfected with a control morpholino or miR-424–morpholino and grown in media containing 5% FBS and VEGF (50 ng/ml) under hypoxia. Cells were fixed and stained with anti-PCNA antibody and developed by Alexa Fluor 488–labeled secondary antibody conjugate. Also stained for F-Actin (rhodamine phalloidin: red) and nuclei (DAPI: blue). Scale bar: 20 μm. (G) Top: Representative photomicrographs of capillary tube formation of HUVECs transfected with miR-control or miR-424. Tube formation was scored after 18 hours. Bottom: Tube formation capacity of HUVECs transfected with control morpholino or miR-424–morpholino. The morpholino effect was investigated under hypoxia. Total magnification, ×100. (H) Morphometric analyses of capillary tube length from 3 independent experiments. Values represent mean ± SD. **P ≤ 0.02.
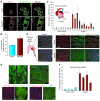
Figure 5. Effect of miR-424 on in vivo angiogenesis.
(A) HUVECs were transduced with either GFP-positive miR-control– or GFP-positive miR-424–expressing retrovirus. Transduced GFP-positive HUVECs were admixed with ovarian cancer cells in Matrigel and subcutaneously implanted into athymic mice, harvested after 7 days, and processed for vessel staining. Mouse ECs (red), HUVECs (green), and chimeric vessels are shown in merged images. Scale bars: 50 μm. (B) Metamorph analysis of colocalized pixels of mouse endothelium (red) and HUVECs (green) is shown. Five animals per group and 2 sections of Matrigels (100 μm from the surface) from each sample were analyzed. Ten frames from each section were used to determine the colocalized pixels. (C) Mu-miR-322 levels in rat cardiac tissues from sham-operated and LAD artery–ligated animals. Peri-infarct (P) and remote (R) areas are shown in the schematic diagram. (D) Photomicrographs show representative images of blood vessels and HIF-1α from the gastrocnemius muscle sections from sham-operated and femoral artery–ligated animals. Vessels were stained with tomato-lectin (red) and HIF-1α (green). Arrowheads indicate colocalization of HIF-1α in blood vessels. Scale bars: 40 μm. (E) Formalin-fixed tissue sections from sham-operated and ligated animals were used for in situ hybridization to determine changes in mu-miR-322. Sections were hybridized with miR-322–specific LNA probe (red). The same sections were also stained for CUL2 (green) and nucleus (blue). Scale bars: 10 μm. (F) q-PCR data of mu-miR-322 levels in the gastrocnemius muscle from sham-operated and ligated animals (n = 3). Values represent mean ± SD. *P < 0.05.
Figure 6. PU.1 regulates miR-424 expression in ECs.
(A) Western blot of PU.1 in the whole-cell lysates from HUVECs under normoxia and hypoxia. β-Actin was used as loading control. (B) Confocal images of HUVECs stained for PU.1 (green), F-actin (rhodamine phalloidin; red), and nuclei (DAPI; blue). Arrowheads indicate nuclear localization of PU.1. Scale bar: 10 μm. (C) Schematic diagram of luciferase reporter construct containing the promoter of miR-424, including the putative PU.1 binding sites. (D) Luciferase reporter activity of HUVECs transfected with a construct containing the promoter of miR-424 with putative PU.1 response elements under normoxia (bar 3) or hypoxia (bar 4). HUVECs were cotransfected with either a control vector (bar 1) or with PU.1-expressing vector (bar 2) under normoxia. Cells were also transfected with Renilla luciferase and used as an internal control. (E) ChIP assay. Chromatin preparations were immunoprecipitated with an anti-PU.1 antibody. Recovered DNA was subjected to q-PCR using previously described primers (34). An unrelated genomic region was amplified as a negative control under normoxia or hypoxia. n = 3. The inset shows representative ChIP blot. (F) Luciferase reporter activity of miR-424 expression after knockdown of PU.1 under hypoxia. HUVECs were cotransfected with a construct containing the promoter of miR-424 with putative PU.1 response elements under hypoxia with either scrambled control construct (left) or with PU.1-specific shRNA (right). Cells were also transfected with Renilla luciferase, which was used as an internal control. Values represent mean ± SD. **P < 0.02; ***P < 0.001. n = 3.
Figure 7. Hypoxia-induced expression of PU.1 is regulated by RUNX-1 (AML1) and C/EBPα.
(A) HUVECs were transfected with a construct containing the miR-424 promoter, including PU.1 response element and luciferase. Luciferase activity was determined under normoxia (bar 1) or hypoxia (bar 2). Cells were cotransfected with RUNX-1 expression vector, normoxia (bar 3), or hypoxia (bar 4). The effect of RUNX-1–specific shRNAs under hypoxia was determined (bars 5–7). (B) Western blot of RUNX-1 in whole-cell lysates from HUVECs cultured under normoxia or hypoxia. (C) Top: Schematic diagram of luciferase reporter constructs. Bottom: Luciferase reporter activity was measured after cotransfecting HUVECs with the construct containing the PU.1-URE-promoter or PU.1-URE-construct lacking the proximal –68-bp C/EBPα binding site. Cells were cultured under normoxia or hypoxia in the presence and absence of RUNX-1–specific shRNA. Cotransfected Renilla luciferase construct was used as an internal control. Binding sites for RUNX-1, R; C/EBPα, C; PU.1, P. (D) Western blot showing increase in C/EBPα levels in HUVECs under hypoxia. (E) Luciferase reporter activity (mean ± SD) in HUVECs transfected with PU.1-URE-promoter-luciferase (schematic diagram, top) under normoxia or hypoxia in the presence and absence of shRNA to C/EBPα. (F) Luciferase reporter activity showing the importance of the C/EBPα binding site at –68 bp of PU.1. HUVECs were transfected with PU.1-URE promoter luciferase construct (left) or a mutant construct lacking the C/EBPα binding site at –68 bp (right) under hypoxia. Values represent mean ± SD. *P < 0.05; ***P ≤ 0.001. n = 3.
Figure 8. Role of PU.1 , RUNX-1, and C/EBPα in the regulation of miR-424 expression.
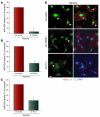
(A–C) q-PCR analysis of miR-424 expression after knockdown using shRNAs specific to C/EBPα (A), RUNX-1 (B), and PU.1 (C) under hypoxia. (D) Representative confocal images showing the effect of shRNA-mediated knockdown of C/EBP-α and PU.1 on HIF-1α nuclear localization. Immunofluorescence studies were carried out by transfecting the cells with shRNA (top), shRNA to C/EBPα (middle), or shRNA to PU.1 (bottom) under hypoxia. Cells were stained for HIF-1α (green) and nucleus (DAPI; blue). F-actin was stained with rhodamine phalloidin (red). Arrows indicate representative cells showing nuclear localization of HIF-1α. Scale bar: 10 μm.
Figure 9. Schematic diagram showing the regulation of HIF-1α by miR-424.
C/EBPα levels increase in ECs under hypoxia. C/EBPα in conjunction with RUNX-1 activates the PU.1 promoter. PU.1 then binds to the miR-424 promoter and induces the expression of miR-424. miR-424 then targets the CUL2 3′UTR and inhibits CUL2 expression. A reduction in CUL2 levels leads to the destabilization of VCBCR U3-ligase complex, which leads to the stabilization and nuclear translocation of HIF-1α in ECs.
Comment in
- The cellular response to hypoxia: tuning the system with microRNAs.
Loscalzo J. Loscalzo J. J Clin Invest. 2010 Nov;120(11):3815-7. doi: 10.1172/JCI45105. Epub 2010 Oct 25. J Clin Invest. 2010. PMID: 20972325 Free PMC article.
Similar articles
- Role of Mir-155 in Controlling HIF-1α Level and Promoting Endothelial Cell Maturation.
Yang D, Wang J, Xiao M, Zhou T, Shi X. Yang D, et al. Sci Rep. 2016 Oct 12;6:35316. doi: 10.1038/srep35316. Sci Rep. 2016. PMID: 27731397 Free PMC article. - The hypoxia-inducible miR-429 regulates hypoxia-inducible factor-1α expression in human endothelial cells through a negative feedback loop.
Bartoszewska S, Kochan K, Piotrowski A, Kamysz W, Ochocka RJ, Collawn JF, Bartoszewski R. Bartoszewska S, et al. FASEB J. 2015 Apr;29(4):1467-79. doi: 10.1096/fj.14-267054. Epub 2014 Dec 30. FASEB J. 2015. PMID: 25550463 Free PMC article. - Inhibition of Exo-miR-19a-3p derived from cardiomyocytes promotes angiogenesis and improves heart function in mice with myocardial infarction via targeting HIF-1α.
Gou L, Xue C, Tang X, Fang Z. Gou L, et al. Aging (Albany NY). 2020 Dec 11;12(23):23609-23618. doi: 10.18632/aging.103563. Epub 2020 Dec 11. Aging (Albany NY). 2020. PMID: 33352533 Free PMC article. - Biology of HIF-1alpha.
Weidemann A, Johnson RS. Weidemann A, et al. Cell Death Differ. 2008 Apr;15(4):621-7. doi: 10.1038/cdd.2008.12. Epub 2008 Feb 15. Cell Death Differ. 2008. PMID: 18259201 Review. - HIF-1alpha modulates energy metabolism in cancer cells by inducing over-expression of specific glycolytic isoforms.
Marín-Hernández A, Gallardo-Pérez JC, Ralph SJ, Rodríguez-Enríquez S, Moreno-Sánchez R. Marín-Hernández A, et al. Mini Rev Med Chem. 2009 Aug;9(9):1084-101. doi: 10.2174/138955709788922610. Mini Rev Med Chem. 2009. PMID: 19689405 Review.
Cited by
- Relationships between vascular oxygen sensing mechanisms and hypertensive disease processes.
Gupte SA, Wolin MS. Gupte SA, et al. Hypertension. 2012 Aug;60(2):269-75. doi: 10.1161/HYPERTENSIONAHA.112.190702. Epub 2012 Jun 18. Hypertension. 2012. PMID: 22710643 Free PMC article. Review. No abstract available. - A brief primer on microRNAs and their roles in angiogenesis.
Anand S. Anand S. Vasc Cell. 2013 Jan 16;5(1):2. doi: 10.1186/2045-824X-5-2. Vasc Cell. 2013. PMID: 23324117 Free PMC article. - Hypoxia-induced hsa_circ_0000826 is linked to liver metastasis of colorectal cancer.
Shi L, Tao C, Tang Y, Xia Y, Li X, Wang X. Shi L, et al. J Clin Lab Anal. 2020 Sep;34(9):e23405. doi: 10.1002/jcla.23405. Epub 2020 Jul 7. J Clin Lab Anal. 2020. PMID: 32633429 Free PMC article. - MicroRNA signatures in tumor tissue related to angiogenesis in non-small cell lung cancer.
Donnem T, Fenton CG, Lonvik K, Berg T, Eklo K, Andersen S, Stenvold H, Al-Shibli K, Al-Saad S, Bremnes RM, Busund LT. Donnem T, et al. PLoS One. 2012;7(1):e29671. doi: 10.1371/journal.pone.0029671. Epub 2012 Jan 25. PLoS One. 2012. PMID: 22295063 Free PMC article. - Tumor suppressive microRNA-424 inhibits osteosarcoma cell migration and invasion via targeting fatty acid synthase.
Long XH, Mao JH, Peng AF, Zhou Y, Huang SH, Liu ZL. Long XH, et al. Exp Ther Med. 2013 Apr;5(4):1048-1052. doi: 10.3892/etm.2013.959. Epub 2013 Feb 18. Exp Ther Med. 2013. PMID: 23599729 Free PMC article.
References
Publication types
MeSH terms
Substances
Grants and funding
- R01 DA012104/DA/NIDA NIH HHS/United States
- R01 DA022935/DA/NIDA NIH HHS/United States
- DA011806/DA/NIDA NIH HHS/United States
- HL081715/HL/NHLBI NIH HHS/United States
- P50 DA011806/DA/NIDA NIH HHS/United States
- T32HL007741/HL/NHLBI NIH HHS/United States
- K02 DA015349/DA/NIDA NIH HHS/United States
- DA022935/DA/NIDA NIH HHS/United States
- R01 CA114340/CA/NCI NIH HHS/United States
- R01 HL081715/HL/NHLBI NIH HHS/United States
- CA114340/CA/NCI NIH HHS/United States
- T32 HL007741/HL/NHLBI NIH HHS/United States
LinkOut - more resources
Full Text Sources
Other Literature Sources
Molecular Biology Databases
Research Materials
