Angiotensin II AT1 receptor blockade ameliorates brain inflammation - PubMed (original) (raw)
Comparative Study
Angiotensin II AT1 receptor blockade ameliorates brain inflammation
Julius Benicky et al. Neuropsychopharmacology. 2011 Mar.
Abstract
Brain inflammation has a critical role in the pathophysiology of brain diseases of high prevalence and economic impact, such as major depression, schizophrenia, post-traumatic stress disorder, Parkinson's and Alzheimer's disease, and traumatic brain injury. Our results demonstrate that systemic administration of the centrally acting angiotensin II AT(1) receptor blocker (ARB) candesartan to normotensive rats decreases the acute brain inflammatory response to administration of the bacterial endotoxin lipopolysaccharide (LPS), a model of brain inflammation. The broad anti-inflammatory effects of candesartan were seen across the entire inflammatory cascade, including decreased production and release to the circulation of centrally acting proinflammatory cytokines, repression of nuclear transcription factors activation in the brain, reduction of gene expression of brain proinflammatory cytokines, cytokine and prostanoid receptors, adhesion molecules, proinflammatory inducible enzymes, and reduced microglia activation. These effects are widespread, occurring not only in well-known brain target areas for circulating proinflammatory factors and LPS, that is, hypothalamic paraventricular nucleus and the subfornical organ, but also in the prefrontal cortex, hippocampus, and amygdala. Candesartan reduced the associated anorexic effects, and ameliorated associated body weight loss and anxiety. Direct anti-inflammatory effects of candesartan were also documented in cultured rat microglia, cerebellar granule cells, and cerebral microvascular endothelial cells. ARBs are widely used in the treatment of hypertension and stroke, and their anti-inflammatory effects contribute to reduce renal and cardiac failure. Our results indicate that these compounds may offer a novel and safe therapeutic approach for the treatment of brain disorders.
Figures
Figure 1
Selective decrease of LPS-induced proinflammatory cytokine release to the circulation by angiotensin II AT1 receptor blockade. Short-term (a) and sustained (b) candesartan treatments were followed by LPS or saline injection as described in Materials and Methods. The levels of cytokines in plasma 3 h after LPS or saline injection were detected by specific ELISA. Data are expressed as means±SEM (_n_=5–16). #P<0.05, ##P<0.01, ###P<0.001 compared with vehicle-LPS group; nd, non-detectable.
Figure 2
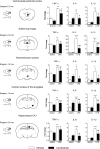
Widespread decrease of LPS-induced proinflammatory cytokine mRNA expression in brain by angiotensin II AT1 receptor blockade. Short-term treatment with candesartan was followed by LPS injection as described in Materials and Methods. Expression of mRNAs of proinflammatory cytokines was detected by real-time PCR in brain structures isolated by punch microdissection from 300 μm coronal brain sections. The scheme on the left illustrates the distance from bregma and the punch area (black circle) in the corresponding coronal sections. The expression of all genes was normalized to the level of GAPDH mRNA. Data are expressed as a fold change relative to vehicle-saline group. Data represent mean±SEM (_n_=5–8). *P<0.05, **P<0.01, ***P<0.001 compared with vehicle-saline group; #P<0.05, ##P<0.01, ###P<0.001 compared with vehicle-LPS group.
Figure 3
Decrease of LPS-induced inflammatory factor mRNA expression in PVN and SFO by angiotensin II AT1 receptor blockade. Short-term candesartan treatment was followed by LPS injection as described in Materials and Methods. Expression of mRNAs of proinflammatory factors and mediators was detected in microdissected PVN and SFO by real-time PCR and was normalized to the level of GAPDH mRNA. Results are expressed as a fold change relative to vehicle-saline group. Data represent mean±SEM (_n_=5–8). *P<0.05, **P<0.01, ***P<0.001, compared with vehicle-saline group; #P<0.05, ##P<0.01, ##P<0.001, compared with vehicle-LPS group.
Figure 4
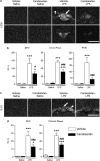
Angiotensin II AT1 receptor blockade attenuates LPS-induced expression of c-Fos mRNA in PVN, SFO, and choroid plexus and IL-1_β_ mRNA in SFO and choroid plexus. Short-term candesartan and LPS were administered as described in Materials and Methods. Expression of c-Fos and IL-1_β_ mRNAs was analyzed by in situ hybridization (a) Representative dark field images of film autoradiograms illustrating the expression of c-Fos mRNA in SFO (top) and PVN (bottom). (b) Quantitative analysis of c-Fos mRNA in SFO and PVN. (c) Representative dark field images of film autoradiograms illustrating the expression of IL-1_β_ mRNA in SFO and choroid plexus. (d) Quantitative analysis of IL-1_β_ mRNA in SFO and choroid plexus. Data are expressed as means±SEM (_n_=7–9). *P<0.05, ***P<0.001 compared with vehicle-saline group, #P<0.05, ###P<0.001 compared with vehicle-LPS group. Scale bar represents 1 mm. Arrow points to SFO; arrowhead indicates adjacent choroid plexus.
Figure 5
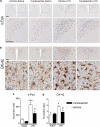
Angiotensin II AT1 receptor blockade suppresses LPS-stimulated c-Fos induction and microglia activation in the PVN. Rats were treated with candesartan for 2 weeks followed by LPS administration as described in Materials and Methods. (a) Representative photomicrographs of c-Fos immunoreactivity in PVN. Rectangle area on the top image is magnified in the image below. Scale bar represents 200 μm. Dashed line outlines the area of PVN. (c) Quantitative analysis of c-Fos immunoreactivity in the PVN. Results are expressed as a number of c-Fos-positive cells per PVN section. (b) Representative photomicrographs of microglia in PVN stained with OX-42 antibody. Dashed line in the upper image outlines the area of PVN. Rectangle area in the upper image is magnified below. Scale bars represent 200 μm in the upper image and 50 μm in the lower image. (d) Quantitative analysis of microglia activation in PVN. An increase in the proportion of area positively stained with OX-42 antibody was used as a measure of microglia activation and is expressed as a percent of total area of PVN per section. Data are shown as means±SEM (_n_=5–8). *P<0.05, ***P<0.001 compared with vehicle-saline group; #P<0.05 compared with vehicle-LPS group.
Figure 6
Angiotensin II AT1 receptor blockade decreases LPS-induced inflammation markers in cerebellar granule cells (a), cerebral microvascular endothelial cells (b) and cortical microglia in culture (c). Cells were isolated and cultured as described in Materials and Methods. Expression of mRNAs was detected by real-time PCR and normalized to the level of GAPDH mRNA. Results are expressed as a fold change relative to vehicle-saline group. The release of TNF-α and IL-1_β_ was determined by ELISA in the incubation media as described in Materials and Methods. Data are presented as means±SEM of three independent experiments performed in duplicates. *P<0.05, **P<0.01, ***P<0.001 compared with vehicle-saline group; #P<0.05, ##P<0.01, ###P<0.001 compared with vehicle-LPS group.
Figure 7
Candesartan ameliorates LPS-induced anorexia and weight loss in Wistar Hannover rats, and decreases anxiety-like behavior in SHRs. (a) Short-term candesartan and LPS were administered as described in Materials and Methods. Food consumption and body weight change were measured the day after LPS injection (_n_=8–10). (b) Short-term candesartan and LPS were administered to SHRs as described in Materials and Methods. At 3 h after LPS injection, the rats were tested on an elevated plus maze for 5 min as described in Materials and Methods (_n_=9–10). Data are expressed as means±SEM. *P<0.05, ***P<0.001 compared with vehicle-saline group, #P<0.05,##P<0.01, ###P<0.001 compared with vehicle-LPS group.
Figure 8
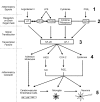
Angiotensin II and inflammatory signal pathways in the brain. AT1 receptor activity is an important factor during brain inflammation. Angiotensin II and inflammatory stimuli interact, enhancing several common downstream signaling pathways. ARBs reduce inflammatory induction of peripheral cytokines and their release to the circulation (1). Inflammatory signals (1) induce transcription of angiotensin II AT1, CD14, cytokine, and EP4 receptors in brain target cells (2). Angiotensin II AT1 receptor blockade eliminates angiotensin II-stimulated downstream signaling and represses downstream transcription factors NF-__κ_B and AP-1 (3). This limits inflammation-induced increase in brain inflammatory cascades: proinflammatory cytokines, cytokine and prostanoid receptors, inducible enzymes leading to PGE2 and NO overproduction and adhesion molecules (4). In turn, this reduces microglia activation and neuronal injury in brain parenchyma (5) limiting the brain inflammatory reaction.
Similar articles
- Angiotensin II AT1 receptor blockade decreases lipopolysaccharide-induced inflammation in the rat adrenal gland.
Sanchez-Lemus E, Murakami Y, Larrayoz-Roldan IM, Moughamian AJ, Pavel J, Nishioku T, Saavedra JM. Sanchez-Lemus E, et al. Endocrinology. 2008 Oct;149(10):5177-88. doi: 10.1210/en.2008-0242. Epub 2008 Jun 12. Endocrinology. 2008. PMID: 18556352 Free PMC article. - In vivo Angiotensin II AT1 receptor blockade selectively inhibits LPS-induced innate immune response and ACTH release in rat pituitary gland.
Sánchez-Lemus E, Benicky J, Pavel J, Saavedra JM. Sánchez-Lemus E, et al. Brain Behav Immun. 2009 Oct;23(7):945-57. doi: 10.1016/j.bbi.2009.04.012. Epub 2009 May 7. Brain Behav Immun. 2009. PMID: 19427376 Free PMC article. - Angiotensin II AT1 blockade reduces the lipopolysaccharide-induced innate immune response in rat spleen.
Sánchez-Lemus E, Benicky J, Pavel J, Larrayoz IM, Zhou J, Baliova M, Nishioku T, Saavedra JM. Sánchez-Lemus E, et al. Am J Physiol Regul Integr Comp Physiol. 2009 May;296(5):R1376-84. doi: 10.1152/ajpregu.90962.2008. Epub 2009 Feb 18. Am J Physiol Regul Integr Comp Physiol. 2009. PMID: 19225144 Free PMC article. - Blockade of brain angiotensin II AT1 receptors ameliorates stress, anxiety, brain inflammation and ischemia: Therapeutic implications.
Saavedra JM, Sánchez-Lemus E, Benicky J. Saavedra JM, et al. Psychoneuroendocrinology. 2011 Jan;36(1):1-18. doi: 10.1016/j.psyneuen.2010.10.001. Epub 2010 Oct 29. Psychoneuroendocrinology. 2011. PMID: 21035950 Free PMC article. Review. - Angiotensin II AT(1) receptor blockers as treatments for inflammatory brain disorders.
Saavedra JM. Saavedra JM. Clin Sci (Lond). 2012 Nov;123(10):567-90. doi: 10.1042/CS20120078. Clin Sci (Lond). 2012. PMID: 22827472 Free PMC article. Review.
Cited by
- Telmisartan Inhibits TNFα-Induced Leukocyte Adhesion by Blocking ICAM-1 Expression in Astroglial Cells but Not in Endothelial Cells.
Jang C, Kim J, Kwon Y, Jo SA. Jang C, et al. Biomol Ther (Seoul). 2020 Sep 1;28(5):423-430. doi: 10.4062/biomolther.2020.119. Biomol Ther (Seoul). 2020. PMID: 32782234 Free PMC article. - Inflammation in Fear- and Anxiety-Based Disorders: PTSD, GAD, and Beyond.
Michopoulos V, Powers A, Gillespie CF, Ressler KJ, Jovanovic T. Michopoulos V, et al. Neuropsychopharmacology. 2017 Jan;42(1):254-270. doi: 10.1038/npp.2016.146. Epub 2016 Aug 11. Neuropsychopharmacology. 2017. PMID: 27510423 Free PMC article. Review. - Cell-based and pharmacological neurorestorative therapies for ischemic stroke.
Venkat P, Shen Y, Chopp M, Chen J. Venkat P, et al. Neuropharmacology. 2018 May 15;134(Pt B):310-322. doi: 10.1016/j.neuropharm.2017.08.036. Epub 2017 Sep 1. Neuropharmacology. 2018. PMID: 28867364 Free PMC article. Review. - Chronic high dose of captopril induces depressive-like behaviors in mice: possible mechanism of regulatory T cell in depression.
Park HS, Han A, Yeo HL, Park MJ, You MJ, Choi HJ, Hong CW, Lee SH, Kim SH, Kim B, Kwon MS. Park HS, et al. Oncotarget. 2017 Aug 3;8(42):72528-72543. doi: 10.18632/oncotarget.19879. eCollection 2017 Sep 22. Oncotarget. 2017. PMID: 29069807 Free PMC article. - Candesartan could ameliorate the COVID-19 cytokine storm.
Elkahloun AG, Saavedra JM. Elkahloun AG, et al. Biomed Pharmacother. 2020 Nov;131:110653. doi: 10.1016/j.biopha.2020.110653. Epub 2020 Aug 20. Biomed Pharmacother. 2020. PMID: 32942152 Free PMC article.
References
- Anderson C. More direct evidence of potential neuroprotective benefits of Angiotensin receptor blockers. Hypertension. 2010;28:429. - PubMed
- Ando H, Zhou J, Macova M, Imboden H, Saavedra JM. Angiotensin II AT1 receptor blockade reverses pathological hypertrophy and inflammation in brain microvessels of spontaneously hypertensive rats. Stroke. 2004;35:1726–1731. - PubMed
Publication types
MeSH terms
Substances
LinkOut - more resources
Full Text Sources
Research Materials


