Reversal of autophagy dysfunction in the TgCRND8 mouse model of Alzheimer's disease ameliorates amyloid pathologies and memory deficits - PubMed (original) (raw)
. 2011 Jan;134(Pt 1):258-77.
doi: 10.1093/brain/awq341.
Philip Stavrides, Panaiyur S Mohan, Susmita Kaushik, Asok Kumar, Masuo Ohno, Stephen D Schmidt, Daniel Wesson, Urmi Bandyopadhyay, Ying Jiang, Monika Pawlik, Corrinne M Peterhoff, Austin J Yang, Donald A Wilson, Peter St George-Hyslop, David Westaway, Paul M Mathews, Efrat Levy, Ana M Cuervo, Ralph A Nixon
Affiliations
- PMID: 21186265
- PMCID: PMC3009842
- DOI: 10.1093/brain/awq341
Reversal of autophagy dysfunction in the TgCRND8 mouse model of Alzheimer's disease ameliorates amyloid pathologies and memory deficits
Dun-Sheng Yang et al. Brain. 2011 Jan.
Abstract
Autophagy, a major degradative pathway for proteins and organelles, is essential for survival of mature neurons. Extensive autophagic-lysosomal pathology in Alzheimer's disease brain contributes to Alzheimer's disease pathogenesis, although the underlying mechanisms are not well understood. Here, we identified and characterized marked intraneuronal amyloid-β peptide/amyloid and lysosomal system pathology in the Alzheimer's disease mouse model TgCRND8 similar to that previously described in Alzheimer's disease brains. We further establish that the basis for these pathologies involves defective proteolytic clearance of neuronal autophagic substrates including amyloid-β peptide. To establish the pathogenic significance of these abnormalities, we enhanced lysosomal cathepsin activities and rates of autophagic protein turnover in TgCRND8 mice by genetically deleting cystatin B, an endogenous inhibitor of lysosomal cysteine proteases. Cystatin B deletion rescued autophagic-lysosomal pathology, reduced abnormal accumulations of amyloid-β peptide, ubiquitinated proteins and other autophagic substrates within autolysosomes/lysosomes and reduced intraneuronal amyloid-β peptide. The amelioration of lysosomal function in TgCRND8 markedly decreased extracellular amyloid deposition and total brain amyloid-β peptide 40 and 42 levels, and prevented the development of deficits of learning and memory in fear conditioning and olfactory habituation tests. Our findings support the pathogenic significance of autophagic-lysosomal dysfunction in Alzheimer's disease and indicate the potential value of restoring normal autophagy as an innovative therapeutic strategy for Alzheimer's disease.
Figures
Figure 1
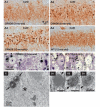
Abnormal lysosome-related compartments in the brains of TgCRND8. Sections from the hippocampal CA1 sector of 2- (A1), 6- (A2) and 12-month-old (A3) TgCRND8 (strain 129S6) and 12-month-old wild-type (WT) (A4) mice (n = 3–6 mice per age per genotype) immunostained with an antibody against mouse cathepsin D (RU2). Representative microphotograph images depict abundant abnormally enlarged lysosome-related granules in CA1 neurons of TgCRND8 at 6- and 12-months of age. (B) Images of the CA1 sector from toluidine blue-stained 1 µm thick sections that were derived from vibratome sections of 12-month-old TgCRND8 (B1) and wild-type (B2) immunostained with RU2. Toluidine blue-stained structures are in blue/purple and RU2-stained granules are in black and denoted by arrowheads. (C) Vibratome brain sections from 6-month-old TgCRND8 were immunostained with the anti-cathepsin D antibody RU2 and then processed for electron microscopy embedding. Areas of the hippocampal CA1 sector containing RU2-positive giant granules (as those seen in Fig. 1A2) were selected for ultrathin sectioning. The electron micrograph shows that a neuronal soma (asterisk) contains two giant RU2-positive granules decorated by strong diaminobenzidine products (arrows). (D) Electron micrographs of the CA1 hippocampal area in 6-month-old TgCRND8 mice depict giant granules (arrows) with single-limiting membranes, containing undigested materials. Scale bars: 10 µm (A and B); 2 µm (C, D1 and D3); 500 nm (D2). CatD = cathepsin D; CRND8 = TgCRND8.
Figure 2
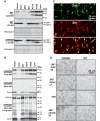
Markers/substrates of the endocytic-autophagic-lysosomal pathways presenting in the giant autolysosomes. Double immunofluorescent labelling of brain sections from 12-month-old TgCRND8 and wild-type (WT) mice (n = 3 mice per genotype) with an antibody against cathepsin D (CatD) (rabbit polyclonal antibody RU2 for A, C and D, sheep polyclonal antibody D-2-3 for B) and an antibody directed against either a lysosomal marker, lysosomal membrane associated protein 2 (LAMP-2) (A), an autophagosomes/autolysosomes marker, LC3 (B), a late endosome marker, lysobisphosphatidic acid (LBPA) (C), or ubiquitin (D). The arrowheads in the overlays depict those giant granules which display double-immunostaining. Images shown are all from the hippocampal CA1 sector. Scale bars: 5 µm (A–D). CRND8 = TgCRND8.
Figure 3
Delayed degradation and accumulation of LC3-II and Aβ within autophagic-lysosomal compartments in the brains of TgCRND8. Subcellular fractions containing the autophagic-lysosomal compartments AV10, AV20 and lysosomes were isolated from brains of 12-month-old TgCRND8 and wild-type (WT) (n = 6 per genotype), and equal amounts of protein from each fraction were subjected to sodium dodecyl sulphate polyacrylamide gel electrophoresis and processed for western blotting (WB) with an antibody directed against cathepsin D (CatD) (A, B, top panels), LC3 (A) or 6E10 (B). Immunoblot for cathepsin D showing that the AV10, AV20 and lysosome fractions exhibit strongest cathepsin D signals, confirming the autophagic-lysosomal origin of these fractions. Corresponding ponceau S stained blots are shown below LC3 antibody-probed blots as loading controls (A). (C) Double immunofluorescent labelling showing that most giant autolysosomes and some smaller lysosomes were co-immunolabelled (C3) by RU2 (C1) and 4G8 (C2) in the CA1 sector of a 6-month-old TgCRND8. Granules displaying only RU2 signal or 4G8 signal are labelled with arrows and arrowheads, respectively. (D) Detection of giant autolysosomes in the CA1 sector by additional antibodies directed against various regions of the Aβ domain, including JRF/AβN/25, JRF/Aβtot/17, 4G8 and JRF/cAβ42/26. The images are representative of the results from three 12-month-old mice per genotype. Scale bars: 10 µm (C); 20 µm (D). AV10 = early autophagic vacuole/autophagosome; AV20 = late autophagic vacuole/autolysosome; CRND8 = TgCRND8; Cyto = cytosol; ER = endoplasmic reticulum-enriched; Homo = homogenate; Lyso = lysosome; Mito = mitochondria.
Figure 4
Subcellular localization of cystatin B. Cultured mouse primary neurons (A and B) were transfected for 1 day with red fluorescent protein (RFP)-tagged mouse cystatin B (CstB) DNA plasmid (OriGene, custom-made ExactORF cDNA clone) according to the procedure provided by the manufacturer, and were then incubated with LysoSensor (Invitrogen) for 2 h to label lysosomal structures, left unfixed but were mounted with anti-fade mounting medium and examined under a confocal microscope (A), or fixed for double labelling using anti-cathepsin D antibody RU2 (B). (C) Brain sections from a wild-type mouse were double-immunolabelled with a homemade affinity purified anti-rat cystatin B antibody and an anti-lysosomal membrane associated protein 2 (LAMP-2) antibody. Arrowheads depict cystatin B-positive granular compartments co-labelled with LysoSensor (A). Scale bar: 10 µm (A–C).
Figure 5
Cystatin B deletion elevating lysosomal protein degradation. (A) Rates of proteolysis of long-lived proteins in fibroblasts from wild-type (WT) and CBKO (CB−/−) mice maintained in the presence (A1) or absence (A2) of serum. Where indicated a combination of ammonium chloride and leupeptin (leup) was added to inhibit proteolysis in the lysosomal compartment. Values are mean + SEM of three different experiments with triplicate samples. Mean differences between the untreated wild-type and CBKO (i.e. without lysosomal inhibitors) at each time point were analysed by two-tailed Student’s _t_-test. *P < 0.05. (B) Rates of proteolysis of long-lived proteins in primary neurons from wild-type and CBKO mice maintained in neurobasal medium supplemented with B27. Mean differences between wild-type and CBKO at each time point were analysed by two-tailed Student’s _t_-test. *P < 0.05.
Figure 6
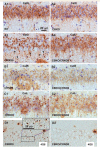
Elimination of giant autolysosomes in the brains of CBKO/TgCRND8. Vibratome (A–C) or paraffin (D) brain sections from a group of wild-type, CBKO, TgCRND8 and CBKO/TgCRND8 mice (strains: 129S6 × 129X1 for the four genotypes) at 6 months of age were processed with antibodies to cathepsin D (RU2) (A), cathepsin B (B), cathepsin L (C) or Aβ (4G8) (D). All images are from the hippocampal CA1 sector showing reduction of giant autolysosomes—revealed by antibodies to either cathepsins or Aβ—in the CBKO/TgCRND8 compared to TgCRND8. The images in (A) are representative of the results from 9–13 mice per genotype, while those in (B–D) are from 3–4 mice per genotype. Arrowheads (A3) depict giant autolysosomes within the stratum radiatum. Scale bars: 20 µm (A–D). CatB = cathepsin B; CatD = cathespin D; CatL = cathepsin L; CRND8 = TgCRND8.
Figure 7
Cystatin B deletion in TgCRND8 elevating cathepsin activities. Results of enzymatic activity assays for cathepsin B (CatB; A), cathepsin L (CatL; B) and cathepsin D (CatD; C1) activities in brain homogenates of wild-type, CBKO, TgCRND8 and CBKO/TgCRND8 (all 6-month-old, n = 9–12 for each genotype). (C2) The cathepsin D activity shown in (C1) was recalculated against the tubulin-normalized cathepsin D values obtained from immunoblots probed with anti-cathepsin D (RU2) and anti-tubulin to yield the cathepsin D-specific activity. Values are the mean ± SEM for each group. Mean differences between genotypes were analysed by one way ANOVA followed by post hoc Bonferroni’s multiple comparison tests. *P < 0.05, **P < 0.01.
Figure 8
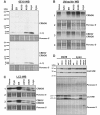
Cystatin B deletion in TgCRND8 promoting clearance of Aβ, ubiquitinated proteins and LC3-II in isolated autophagic-lysosomal compartments. Subcellular fractions containing the autophagic-lysosomal compartments AV10, AV20 and lysosomes were isolated from brains of 6-month-old TgCRND8 and CBKO/TgCRND8 (n = 8 per genotype). Equal amounts of proteins from each fraction were subjected to sodium dodecyl sulphate polyacrylamide gel electrophoresis and processed for western blotting with an antibody directed against Aβ (A), ubiquitin (B) or LC3 (C), and representative blots are shown. (D) AV20 and Lyso fractions from all four genotypes were loaded onto one gel and processed with an anti-cathepsin D (RU2) or anti-LC3 antibody. Corresponding ponceau S-stained blots are shown below the antibody-probed blots as loading controls (A–D). AV10 = early autophagic vacuole/autophagosome; AV20 = late autophagic vacuole/autolysosome; CRND8 = TgCRND8; Cyto = cytosol; ER = endoplasmic reticulum-enriched; Homo = homogenate; Lyso = lysosome; WB = western blotting; WT = wild-type.
Figure 9
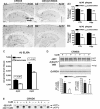
Reduction of amyloid load and Aβ levels in the brains of CBKO/TgCRND8. Immunocytochemistry using antibodies to Aβ40 (A) or Aβ42 (B) revealed reduction of amyloid deposition in 6-month-old CBKO/TgCRND8 compared to age-matched TgCRND8. (A3 and B3) Results of quantification of amyloid load detected with antibodies to Aβ40 (A3) or Aβ42 (B3) in the cerebral cortex (CTX) and the hippocampus (Hipp) from TgCRND8 (n = 10; 9 males + 1 female) and CBKO/TgCRND8 (n = 12; 3 males + 9 females), expressed as the percent difference from TgCRND8. Values are the mean ± SEM for each group. Significant differences were analysed by two-tailed Student’s _t_-test. *P < 0.005, **P < 0.001. (C) Levels of Aβ40 and Aβ42 in the brains of 6-month-old TgCRND8 (n = 11; 9 males + 2 females) and CBKO/TgCRND8 (n = 13; 3 males + 10 females) were measured in formic acid-extracted, sucrose homogenates using an enzyme-linked immunosorbent assay method. Values are the mean ± SEM for each group. Significant differences were analysed by two-tailed Student’s _t_-test. (D) Western blotting (WB) using the antibody JRF/Aβtot/17 (top) on brain homogenates from 6-month-old TgCRND8 and CBKO/TgCRND8. The glyceraldehyde 3-phosphate dehydrogenase (GAPDH) blot serves as a loading control. Graphs are results of densitometric analyses of Aβ (bottom left) or APP holoprotein (bottom right) signals normalized by the glyceraldehyde 3-phosphate dehydrogenase signals (**P < 0.01, #P = 0.72, n = 8 per genotype, two-tailed Student’s _t_-test). (E) Immunoprecipitation (IP) of brain homogenates with 6E10 followed by western blotting (WB) with 22C11. APP Holo = APP holoprotein and holoprotein derivatives; CRND8 = TgCRND8; CstB = cystatin B. Scale bars: 500 µm (A1, A2, B1 and B2).
Figure 10
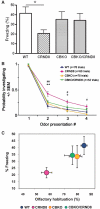
Improved behavioural performance in the CBKO/TgCRND8. (A) Effects of CBKO on impaired contextual fear memory in TgCRND8 mice. The 6-month-old wild-type (WT) (n = 10), TgCRND8 (n = 9), CBKO (n = 10) and CBKO/TgCRND8 (n = 7) were trained with two conditioned stimulus-unconditioned stimulus pairings for contextual fear conditioning. Only TgCRND8 mice show significantly lower levels of contextual freezing than wild-type control mice when tested 24 h after training (*P < 0.05; two-tailed Student’s _t_-test). There is a trend toward increases in freezing of CBKO/TgCRND8 mice as compared to that of TgCRND8 mice (P = 0.08). (B) Reversal of APP olfactory behaviour phenotype in CBKO/TgCRND8 mice. Results from an odour habituation test from 6-month-old wild-type (n = 10), TgCRND8 (n = 8), CBKO (n = 9) and CBKO/TgCRND8 mice (n = 7). Odour investigation duration was normalized to a maximum value of ‘1’ per odour for each mouse. TgCRND8 mice (pink) displayed an increased latency to habituate to novel odours in comparison to wild-type (blue) and CBKO mice (orange), which was reversed when TgCRND8 was crossed with CBKO (CBKO/TgCRND8, green). *P < 0.05, **P < 0.01, CBKO/TgCRND8 versus TgCRND8; #P < 0.01, ##P < 0.0001, wild-type versus TgCRND8; ANOVA and Fisher’s protected least significant difference. (C) Comparison of the results from the two behavioural assays. To test a correlation between contextual and olfactory memory performances, percent freezing levels in the contextual fear conditioning are plotted against percent reductions of habituation from Trial 1 to Trial 2 in the odour habituation test. CRND8 = TgCRND8.
Similar articles
- Defective macroautophagic turnover of brain lipids in the TgCRND8 Alzheimer mouse model: prevention by correcting lysosomal proteolytic deficits.
Yang DS, Stavrides P, Saito M, Kumar A, Rodriguez-Navarro JA, Pawlik M, Huo C, Walkley SU, Saito M, Cuervo AM, Nixon RA. Yang DS, et al. Brain. 2014 Dec;137(Pt 12):3300-18. doi: 10.1093/brain/awu278. Epub 2014 Sep 29. Brain. 2014. PMID: 25270989 Free PMC article. - Therapeutic effects of remediating autophagy failure in a mouse model of Alzheimer disease by enhancing lysosomal proteolysis.
Yang DS, Stavrides P, Mohan PS, Kaushik S, Kumar A, Ohno M, Schmidt SD, Wesson DW, Bandyopadhyay U, Jiang Y, Pawlik M, Peterhoff CM, Yang AJ, Wilson DA, St George-Hyslop P, Westaway D, Mathews PM, Levy E, Cuervo AM, Nixon RA. Yang DS, et al. Autophagy. 2011 Jul;7(7):788-9. doi: 10.4161/auto.7.7.15596. Epub 2011 Jul 1. Autophagy. 2011. PMID: 21464620 Free PMC article. - Cyclodextrin has conflicting actions on autophagy flux in vivo in brains of normal and Alzheimer model mice.
Yang DS, Stavrides P, Kumar A, Jiang Y, Mohan PS, Ohno M, Dobrenis K, Davidson CD, Saito M, Pawlik M, Huo C, Walkley SU, Nixon RA. Yang DS, et al. Hum Mol Genet. 2017 Mar 1;26(5):843-859. doi: 10.1093/hmg/ddx001. Hum Mol Genet. 2017. PMID: 28062666 Free PMC article. - Neuronal autophagy: self-eating or self-cannibalism in Alzheimer's disease.
Ułamek-Kozioł M, Furmaga-Jabłońska W, Januszewski S, Brzozowska J, Sciślewska M, Jabłoński M, Pluta R. Ułamek-Kozioł M, et al. Neurochem Res. 2013 Sep;38(9):1769-73. doi: 10.1007/s11064-013-1082-4. Epub 2013 Jun 5. Neurochem Res. 2013. PMID: 23737325 Free PMC article. Review. - Alzheimer's disease and the autophagic-lysosomal system.
Chung KM, Hernández N, Sproul AA, Yu WH. Chung KM, et al. Neurosci Lett. 2019 Apr 1;697:49-58. doi: 10.1016/j.neulet.2018.05.017. Epub 2018 May 18. Neurosci Lett. 2019. PMID: 29758300 Review.
Cited by
- Rapamycin attenuates the progression of tau pathology in P301S tau transgenic mice.
Ozcelik S, Fraser G, Castets P, Schaeffer V, Skachokova Z, Breu K, Clavaguera F, Sinnreich M, Kappos L, Goedert M, Tolnay M, Winkler DT. Ozcelik S, et al. PLoS One. 2013 May 7;8(5):e62459. doi: 10.1371/journal.pone.0062459. Print 2013. PLoS One. 2013. PMID: 23667480 Free PMC article. - p62 improves AD-like pathology by increasing autophagy.
Caccamo A, Ferreira E, Branca C, Oddo S. Caccamo A, et al. Mol Psychiatry. 2017 Jun;22(6):865-873. doi: 10.1038/mp.2016.139. Epub 2016 Aug 30. Mol Psychiatry. 2017. PMID: 27573878 Free PMC article. Retracted. - A genetic cause of Alzheimer disease: mechanistic insights from Down syndrome.
Wiseman FK, Al-Janabi T, Hardy J, Karmiloff-Smith A, Nizetic D, Tybulewicz VL, Fisher EM, Strydom A. Wiseman FK, et al. Nat Rev Neurosci. 2015 Sep;16(9):564-74. doi: 10.1038/nrn3983. Epub 2015 Aug 5. Nat Rev Neurosci. 2015. PMID: 26243569 Free PMC article. Review. - The ubiquitin-proteasome system and the autophagic-lysosomal system in Alzheimer disease.
Ihara Y, Morishima-Kawashima M, Nixon R. Ihara Y, et al. Cold Spring Harb Perspect Med. 2012 Aug 1;2(8):a006361. doi: 10.1101/cshperspect.a006361. Cold Spring Harb Perspect Med. 2012. PMID: 22908190 Free PMC article. - Lysosome: The metabolic signaling hub.
Lamming DW, Bar-Peled L. Lamming DW, et al. Traffic. 2019 Jan;20(1):27-38. doi: 10.1111/tra.12617. Epub 2018 Nov 14. Traffic. 2019. PMID: 30306667 Free PMC article. Review.
References
- Abrahamson M. Cystatins. Methods Enzymol. 1994;244:685–700. - PubMed
- Alakurtti K, Weber E, Rinne R, Theil G, de Haan GJ, Lindhout D, et al. Loss of lysosomal association of cystatin B proteins representing progressive myoclonus epilepsy, EPM1, mutations. Eur J Hum Genet. 2005;13:208–15. - PubMed
- Anderluh G, Gutierrez-Aguirre I, Rabzelj S, Ceru S, Kopitar-Jerala N, Macek P, et al. Interaction of human stefin B in the prefibrillar oligomeric form with membranes. Correlation with cellular toxicity. FEBS J. 2005;272:3042–51. - PubMed
- Auteri J, Okada A, Bochaki V, Dice J. Regulation of intracellular protein degradation in IMR-90 human diploid fibroblasts. J Cell Physiol. 1983;115:167–74. - PubMed
- Bayer TA, Wirths O. Review on the APP/PS1KI mouse model: intraneuronal Abeta accumulation triggers axonopathy, neuron loss and working memory impairment. Genes Brain Behav. 2008;7(Suppl. 1):6–11. - PubMed
Publication types
MeSH terms
Substances
LinkOut - more resources
Full Text Sources
Other Literature Sources
Medical
Research Materials
