Nestin is a novel target for suppressing pancreatic cancer cell migration, invasion and metastasis - PubMed (original) (raw)
Nestin is a novel target for suppressing pancreatic cancer cell migration, invasion and metastasis
Yoko Matsuda et al. Cancer Biol Ther. 2011.
Abstract
Nestin, is a class VI intermediate filament (IF) that is expressed in 30% of pancreatic ductal adenocarcinoma (PDAC) cases, and its expression in PDAC positively correlates with peripancreatic invasion. An expression vector carrying a short hairpin RNA (shRNA) targeting nestin was stably transfected into PANC-1 and PK-45H human pancreatic cancer cells, which express high nestin levels. Alterations in morphology and alignment of actin filaments and α-tubulin were examined by phase-contrast and immunocytochemistry. Effects on cell growth, migration in scratch and Boyden chamber assays, invasion, cell adhesion, and in vivo growth were determined. Differences in mRNA levels were examined by arrays. Nestin shRNA-transfected cells exhibited decreased nestin expression, a sheet-like appearance with tight cell-cell adhesion, increased expression of filamentous F-actin and E-cadherin, and attenuated migration and invasion, both of which were enhanced following nestin re-expression. Expression of α-tubulin, and in vitro cell growth and adhesion were not altered by nestin down-regulation, whereas hepatic metastases were decreased. Thus, nestin plays important roles in pancreatic cancer cell migration, invasion and metastasis by selectively modulating the expression of actin and cell adhesion molecules, and may therefore be a novel therapeutic target in PDAC.
Figures
Figure 1
Effects of shRNA targeting nestin on nestin mRNA and protein levels. Plasmids encoding a shRNA targeting nestin (Sh) or a scrambled sham vector (Sc) were stably transfected into PANC-1 (A and B) and PK-45H cells (C and D). (A and C) RNA was subjected to qRT-PCR. Relative expression levels were determined in triplicate. **p < 0.01, compared with the corresponding sham. (B and D) Membranes were probed for nestin (upper panel) and reprobed with an anti-GAPDH antibody (lower panel) to confirm equivalent loading of lanes. Each part is representative of three distinct experiments.
Figure 2
Effects of shRNA targeting nestin on cell morphology. (A) Sham-transfected PANC-1 and PK-45H cells were either round or had a short spindle-like appearance. Nestin shRNA-transfected cells exhibited a sheet-like appearance with the cells clustering to each other. (B) There was also increased F-actin expression at the periphery of the cells, and a dramatic increase in stress fiber formation of F-actin by comparison with sham cells. (C) expression patterns of α-tubulin were similar in sham and shRNA-transfected cells. (D) Merged images of F-actin and α-tubulin showed strong co-expression of the proteins (yellow) at the periphery of nestin shRNA-transfected PANC-1 and PK-45H cells. (A) phase-contrast images of live cells (original magnification, ×200); (B) immunofluorescence of F-actin (red, original magnification, ×1,000); (C) immunofluorescence of α-tubulin (green, original magnification, ×1,000); (D) Merged images of F-actin and α-tubulin (yellow, Original magnification, ×1,000).
Figure 3
Effects of nestin shRNA on cell growth and adhesion. (A) Wild type (Wild), sham (Sc) and nestin shRNA-transfected (Sh) cells were plated at a density of 5 × 10³ cells/well in 96-well plates, and incubated for indicated times. Data are expressed as absorbance at 450 nM, and are the means ± SEM of three determinations per experiment from three separate experiments. (B) six-week-old male nude mice were subcutaneously injected with 1 × 10⁶ the indicated sham-transfected sham (Sc, closed bars) or nestin shRNA-transfected (Sh, open bars) cells. Tumor volume was determined 21 days following cell injection. Data are means ± SEM from six mice per group. (C) Nestin shRNA-transfected cells were seeded at a density of 2 × 10⁴ cells/well on each of the indicated ECM (20 µg/ml) component. Cell adhesion was assessed as described in the Methods section. Data are expressed as absorbance at 450 nm, and are the means ± SEM of three determinations per experiment from three separate experiments.
Figure 4
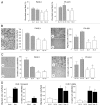
Scratch and Boyden chamber assays. (A) scratch assay. The cell monolayer was scratched in a straight line with a p200 pipette tip. The percentage of wounded area that was filled was statistically smaller in nestin shRNA-transfected PANC-1 cells (Sh-1 and Sh-10) by comparison with sham cells (Sc-1 and Sc-4, *p < 0.05), and in nestin shRNA-transfected cells (Sh-7 and Sh-8, **p < 0.01) by comparison with sham cells (Sc-13 and Sc-16). (B) Boyden chamber migration assay. PANC-1 and PK-45h cells were seeded on the upper component of cell culture inserts at a density of 1 × 10⁵ cells/insert and then incubated for 8 (PANC-1) or 20 hrs (PK-45H). Migrating cells underneath the inserts were counted as described in the Methods section. *p < 0.05 when compared with corresponding sham controls. (C) Boyden chamber invasion assay. PANC-1 and PK-45H cells were seeded on the inner surface of Matrigel-coated inserts and incubated for 8 (PANC-1) or 20 hrs (PK-45H). *p < 0.05 when compared with the mean values for the corresponding sham controls. (D) plasmids encoding the full length nestin sequence (Nes) or an empty vector (Mock) were either transiently or stably transfected into KLM-1 cells, as indicated. Seventy-two hrs after transient transfection, cells were seeded on the inner surface of inserts and incubated for 20 hrs. In the case of stably-transfected KLM-1 cells, two different mock clones (M-10 and M-24) and two different Nes clones (Nes-9 and Nes-12) were seeded on the inner surface of inserts and incubated for 20 hrs. *p < 0.05 and **p < 0.01 when compared with Mock cells. All data are the means ± SEM of duplicate determinations from three independent experiments.
Figure 5
Effects of transient nestin transfection on cell migration and invasion. (A) plasmids encoding the full length nestin sequence or an empty vector were transfected into nestin shRNA-transfected PANC-1 and PK-45H clones. Seventy-two hours after transfection, cell lysates were collected, and nestin mRNA and protein levels were measured by qRT-PCR and western blotting, respectively. GAPDH served as an internal control. **p < 0.01 when compared with the corresponding Sh-Mock cells. (B) scratch assay. The percentage of wounded area that was filled was statistically higher (*p < 0.05) in nestin-transfected (Sh-Nes) cells than in Mock cells (Sh-Mock). (C) Boyden chamber migration assay. Sh-Nes cells migrated more (*p < 0.05) than the Sh-Mock cells. (D) Boyden chamber invasion assay. Sh-Nes cells were more invasive than the Sh-Mock cells. *p < 0.05. **p < 0.01, when compared with respective controls. All data are the means ± SEM of duplicate determinations from three independent experiments.
Figure 6
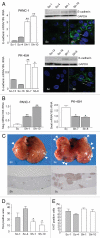
Effects of nestin shRNA on E-cadherin expression and hepatic metastases. (A) E-cadherin mRNA and protein levels. E-cadherin mRNA levels were higher (*p < 0.05 and **p < 0.01) in nestin shRNA-transfected cells (Sh) by comparison with sham cells (Sc). A 120 kD band corresponding to E-cadherin was expressed at high levels in nestin shRNA-transfected cells, but was either weak or undetectable in the corresponding sham cells. Nestin shRNA-transfected cells exhibited an intense E-cadherin immunofluorescent signal at their cell-cell junctions 1 (arrows). Original magnification, ×1,000. (B) slug and snail mRNA levels. Slug mRNA levels were higher (**p < 0.01) in nestin shRNA-transfected PANC-1 cells (Sh) by comparison with the corresponding sham cells (Sc), whereas snail mRNa levels were lower (*p < 0.05) in nestin shRNA-transfected PK-45H cells (Sh) by comparison with the corresponding sham cells (Sc). (C) hepatic metastases. There were fewer metastatic nodules (arrowheads) and there was decreased hLa class I immunoreactivity in the livers of mice injected with nestin shRNA-transfected PANC-1 (Sh) cells than in the livers of mice injected with sham (Sh) cells. (D) HLA analysis. The percent of HLA class I positive cancer areas/total liver areas was significantly decreased in the livers of mice injected with nestin shRNA-transfected PANC-1 cells (*p < 0.05). (E) Ki-67 analysis. The percent of Ki-67 positive cancer cells/total cancer cells was similar in the livers of sham and nestin shRNA-transfected PANC-1 cells.
Comment in
- Pancreatic cancer with Nest-in tendencies.
Maund SL, Cramer SD. Maund SL, et al. Cancer Biol Ther. 2011 Mar 15;11(6):559-61. doi: 10.4161/cbt.11.6.14833. Epub 2011 Mar 15. Cancer Biol Ther. 2011. PMID: 21266845 Free PMC article. No abstract available.
Similar articles
- Nestin as a novel therapeutic target for pancreatic cancer via tumor angiogenesis.
Yamahatsu K, Matsuda Y, Ishiwata T, Uchida E, Naito Z. Yamahatsu K, et al. Int J Oncol. 2012 May;40(5):1345-57. doi: 10.3892/ijo.2012.1333. Epub 2012 Jan 13. Int J Oncol. 2012. PMID: 22246533 - Nestin delineates pancreatic cancer stem cells in metastatic foci of NOD/Shi-scid IL2Rγ(null) (NOG) mice.
Matsuda Y, Yoshimura H, Ueda J, Naito Z, Korc M, Ishiwata T. Matsuda Y, et al. Am J Pathol. 2014 Mar;184(3):674-85. doi: 10.1016/j.ajpath.2013.11.014. Epub 2014 Jan 9. Am J Pathol. 2014. PMID: 24412093 Free PMC article. - Nestin expression correlates with nerve and retroperitoneal tissue invasion in pancreatic cancer.
Kawamoto M, Ishiwata T, Cho K, Uchida E, Korc M, Naito Z, Tajiri T. Kawamoto M, et al. Hum Pathol. 2009 Feb;40(2):189-98. doi: 10.1016/j.humpath.2008.02.022. Epub 2008 Sep 16. Hum Pathol. 2009. PMID: 18799194 Free PMC article. - Nestin and other putative cancer stem cell markers in pancreatic cancer.
Matsuda Y, Kure S, Ishiwata T. Matsuda Y, et al. Med Mol Morphol. 2012 Jun;45(2):59-65. doi: 10.1007/s00795-012-0571-x. Epub 2012 Jun 21. Med Mol Morphol. 2012. PMID: 22718289 Review. - Clathrin-containing adhesion complexes.
Lock JG, Baschieri F, Jones MC, Humphries JD, Montagnac G, Strömblad S, Humphries MJ. Lock JG, et al. J Cell Biol. 2019 Jul 1;218(7):2086-2095. doi: 10.1083/jcb.201811160. Epub 2019 Jun 17. J Cell Biol. 2019. PMID: 31208994 Free PMC article. Review.
Cited by
- Nestin suppression attenuates invasive potential of endometrial cancer cells by downregulating TGF-β signaling pathway.
Bokhari AA, Baker TM, Dorjbal B, Waheed S, Zahn CM, Hamilton CA, Maxwell GL, Syed V. Bokhari AA, et al. Oncotarget. 2016 Oct 25;7(43):69733-69748. doi: 10.18632/oncotarget.11947. Oncotarget. 2016. PMID: 27626172 Free PMC article. - The Microbiome Tumor Axis: How the Microbiome Could Contribute to Clonal Heterogeneity and Disease Outcome in Pancreatic Cancer.
Basu M, Philipp LM, Baines JF, Sebens S. Basu M, et al. Front Oncol. 2021 Sep 23;11:740606. doi: 10.3389/fonc.2021.740606. eCollection 2021. Front Oncol. 2021. PMID: 34631577 Free PMC article. - Role of cellular cytoskeleton in epithelial-mesenchymal transition process during cancer progression.
Sun BO, Fang Y, Li Z, Chen Z, Xiang J. Sun BO, et al. Biomed Rep. 2015 Sep;3(5):603-610. doi: 10.3892/br.2015.494. Epub 2015 Jul 27. Biomed Rep. 2015. PMID: 26405532 Free PMC article. - Nestin expression as an independent indicator of poor prognosis for patients with anaplastic thyroid cancer.
Kurata K, Onoda N, Noda S, Kashiwagi S, Asano Y, Kawajiri H, Takashima T, Tanaka S, Ohsawa M, Hirakawa K. Kurata K, et al. Oncol Lett. 2015 Aug;10(2):850-856. doi: 10.3892/ol.2015.3366. Epub 2015 Jun 11. Oncol Lett. 2015. PMID: 26622582 Free PMC article. - Prostate cancer stem cell-targeted efficacy of a new-generation taxoid, SBT-1214 and novel polyenolic zinc-binding curcuminoid, CMC2.24.
Botchkina GI, Zuniga ES, Rowehl RH, Park R, Bhalla R, Bialkowska AB, Johnson F, Golub LM, Zhang Y, Ojima I, Shroyer KR. Botchkina GI, et al. PLoS One. 2013 Sep 24;8(9):e69884. doi: 10.1371/journal.pone.0069884. eCollection 2013. PLoS One. 2013. PMID: 24086245 Free PMC article.
References
- Gilles C, Polette M, Zahm JM, Tournier JM, Volders L, Foidart JM, et al. Vimentin contributes to human mammary epithelial cell migration. J Cell Sci. 1999;112:4615–4625. - PubMed
Publication types
MeSH terms
Substances
Grants and funding
- R37 CA075059-12/CA/NCI NIH HHS/United States
- R37 CA075059/CA/NCI NIH HHS/United States
- R37 CA075059-11/CA/NCI NIH HHS/United States
- R37 CA075059-13/CA/NCI NIH HHS/United States
- R01 CA075059/CA/NCI NIH HHS/United States
- R37 CA075059-14/CA/NCI NIH HHS/United States
- R37 CA075059-11S1/CA/NCI NIH HHS/United States
- CA-R37-075059/CA/NCI NIH HHS/United States
LinkOut - more resources
Full Text Sources
Other Literature Sources
Miscellaneous


