Temporal changes in Hec1 phosphorylation control kinetochore-microtubule attachment stability during mitosis - PubMed (original) (raw)
. 2011 Feb 15;124(Pt 4):622-34.
doi: 10.1242/jcs.072629. Epub 2011 Jan 25.
Affiliations
- PMID: 21266467
- PMCID: PMC3031373
- DOI: 10.1242/jcs.072629
Temporal changes in Hec1 phosphorylation control kinetochore-microtubule attachment stability during mitosis
Keith F DeLuca et al. J Cell Sci. 2011.
Abstract
Precise control of the attachment strength between kinetochores and spindle microtubules is essential to preserve genomic stability. Aurora B kinase has been implicated in regulating the stability of kinetochore-microtubule attachments but its relevant kinetochore targets in cells remain unclear. Here, we identify multiple serine residues within the N-terminus of the kinetochore protein Hec1 that are phosphorylated in an Aurora-B-kinase-dependent manner during mitosis. On all identified target sites, Hec1 phosphorylation at kinetochores is high in early mitosis and decreases significantly as chromosomes bi-orient. Furthermore, once dephosphorylated, Hec1 is not highly rephosphorylated in response to loss of kinetochore-microtubule attachment or tension. We find that a subpopulation of Aurora B kinase remains localized at the outer kinetochore even upon Hec1 dephosphorylation, suggesting that Hec1 phosphorylation by Aurora B might not be regulated wholly by spatial positioning of the kinase. Our results define a role for Hec1 phosphorylation in kinetochore-microtubule destabilization and error correction in early mitosis and for Hec1 dephosphorylation in maintaining stable attachments in late mitosis.
Figures
Fig. 1.
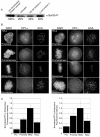
Hec1 N-terminal phosphorylation is required for normal chromosome congression and regulation of kinetochore–MT attachments. (A) Immunofluorescence images of PtK1 cells depleted of endogenous Hec1 and rescued with either WT-Hec1–GFP or 9A-Hec1–GFP. (B) Quantification of end- on microtubule association with kinetochores (WT-Hec1–GFP prometaphase: _n_=448 kinetochores, 19 cells; WT-Hec1–GFP late prometaphase and metaphase: _n_=428 kinetochores, 14 cells; 9A-Hec1–GFP: _n_=247 kinetochores, 10 cells). (C) Quantification of inter-kinetochore distances in PtK1 cells. Distances between sister pairs were measured from GFP-centroid to GFP-centroid. For WT-Hec1–GFP rescued cells, measurements were taken from prophase and metaphase cells (_n_=45 kinetochore pairs, 10 cells and _n_=128 kinetochore pairs, 22 cells, respectively). For cells rescued with 9A-Hec1–GFP, inter-kinetochore distances were measured only from sister pairs of bi-oriented chromosomes (_n_=141 kinetochore pairs, 19 cells). (D) Quantification of chromosome alignment (_n_=161 cells for WT-Hec1–GFP; _n_=107 for 9A-Hec1–GFP). Cells containing less than 2 chromosomes off a well-defined metaphase plate were scored as having ‘aligned’ chromosomes. Cells containing 2–3 chromosomes off a metaphase plate were scored as having ‘partially aligned’ chromosomes. Cells exhibiting no discernible metaphase plate or those containing greater than 3 chromosomes off a metaphase plate were scored as having ‘unaligned’ chromosomes. (E) Immunofluorescence images of HeLa cells depleted of endogenous Hec1 and rescued with either WT-Hec1–GFP or 9A-Hec1–GFP. (F) Quantification of inter-kinetochore distances in HeLa cells. The n values are as follows: WT-Hec1–GFP metaphase, _n_=76 kinetochore pairs, 6 cells; WT-Hec1–GFP prophase, _n_=24 kinetochore pairs, 2 cells; 9A-Hec1–GFP (only kinetochores from bi-oriented chromosomes were scored), _n_=59 kinetochore pairs, 5 cells. (G) Immunofluorescence images of cells subjected to a monastrol washout assay. The top two rows show cells transfected with the GFP-fusion protein as indicated. Cells were treated with monastrol for 2 hours and then incubated in fresh culture media + MG132 for 1 hour. Samples of cells were subjected to immunofluorescence just prior to initiation of the monastrol washout, 20 minutes post-initiation of washout and 60 minutes post-initiation of washout. For the experiment in the bottom row, untransfected cells were treated with monastrol for 2 hours and then incubated in fresh media containing MG132 and 10 μM ZM447439. The predominant phenotypes at the indicated time-points are shown. Chromosomes are shown in blue, microtubules are shown in red and kinetochores are shown in green (GFP–Hec1 for the top two panels; ACA antibody staining in the bottom panel). (H) Quantification of monastrol washout experiment. For each condition, at least 75 cells were scored. Error bars indicate s.d.
Fig. 2.
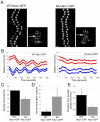
Hec1 N-terminal phosphorylation is required for normal kinetochore oscillations. (A) Kymographs of a single sister kinetochore pair from live-cell time-lapse imaging sequences of PtK1 cells depleted of endogenous Hec1 and rescued with WT-Hec1–GFP (left) or 9A-Hec1–GFP (right). The arrows indicate which pairs are represented in the kymographs. (B) Plots indicating kinetochore oscillation movement over time. For each rescue experiment, two representative sister kinetochore pairs are shown. (C) Quantification of average velocity of kinetochore movement in rescued cells. Both pole-ward and away from the pole movements were measured (for graphs in C, D and E: WT-Hec1–GFP rescue, _n_=9 kinetochores, 4 cells; 9A-Hec1–GFP rescue, _n_=13 kinetochores, 4 cells). (D) Quantification of percent time in pause. If a kinetochore did not move for two sequential time points (6 seconds), a pause event was recorded. The percentage of time spent ‘paused’ was then calculated from the total time of the time-lapse image sequence. (E) Deviation from average position (Stumpff et al., 2008) was quantified for kinetochores in cells rescued with WT-Hec1–GFP and 9A Hec1–GFP kinetochores (see Materials and Methods). Scale bars: 2 μm. Error bars indicate s.d.
Fig. 3.
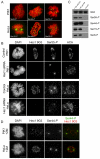
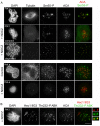
Hec1 is phosphorylated at kinetochores on multiple N-terminal serine residues and phosphorylation is dependent on Aurora B kinase. (A) Immunofluorescence images of PtK1 and HeLa cells stained with Hec1 phosphorylation-specific antibodies. Antibodies raised against peptides containing phosphorylated Ser8, Ser44 and Ser55 recognized kinetochores consistently in PtK1 cells, and antibodies raised against peptides containing phosphorylated Ser15, Ser44 and Ser55 recognized kinetochores consistently in HeLa cells. (B) Immunofluorescence images of mock-depleted or Hec1-depleted PtK1 and HeLa cells probed for Ser55-P. Kinetochore localization of the anti-Ser55-P antibody and the Hec1 9G3 antibody is lost upon depletion of Hec1. (C) Immunoblots of recombinantly expressed and purified NDC80Bonsai complexes probed with the non-phosphorylation-specific Hec1 9G3 antibody and the 4 phosphorylation-specific Hec1 antibodies. Purified NDC80Bonsai complexes were incubated with activated Aurora B kinase in the presence or absence of ATP and subjected to SDS-PAGE prior to immunoblot analysis. (D) Immunofluorescence images of a PtK1 and HeLa cell treated with 2 μM ZM447439. Kinetochore localization of Ser44-P is significantly diminished in both cell types in response to treatment with the inhibitor.
Fig. 4.
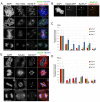
Phosphorylation of Hec1 at kinetochores peaks in early mitosis and decreases as chromosomes bi-orient. (A) Localization of Ser55-P throughout mitosis in PtK1 cells. Cells were fixed and immunostained using a non-phosphorylation-specific Hec1 9G3 antibody and an antibody to Ser55-P. Arrows indicate sister kinetochore pairs whose inter-kinetochore axes are not parallel to the spindle axis. (B) Mad2–GFP localizes to kinetochores that are positive for Ser55-P staining in PtK1 cells. The arrow points to a kinetochore with high levels of both Mad2–GFP and Ser55-P, and the arrowhead points to a kinetochore with high levels of Mad2–GFP and low levels of Ser55-P. (C) Quantification of Ser55-P, Ser44-P and Ser8-P levels at kinetochores in PtK1 cells. For each phase of mitosis or drug condition, at least 100 kinetochores from 10 cells were quantified. In all cases, kinetochore fluorescence intensity was normalized to the fluorescence intensity of ACA. (D) Quantification of Ser55-P, Ser44-P and Ser15-P levels at kinetochores in HeLa cells. For each phase of mitosis or drug condition, at least 100 kinetochores from 10 cells were quantified. In all cases, kinetochore fluorescence intensity was normalized to the fluorescence intensity of ACA. For the quantification of kinetochores in nocodazole-treated cells in C and D, kinetochores were measured from drug-treated cells that had compact chromosome morphology, suggesting that they did not enter mitosis in the presence of the drug, but rather that the drug was added after some degree of chromosome alignment. (E) Localization of Ser44-P throughout mitosis in HeLa cells. Cells were fixed and immunostained using antibodies to Ser44-P and tubulin. Error bars indicate s.d.
Fig. 5.
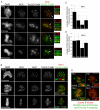
Phosphorylated Aurora B kinase localizes to the centromere and kinetochore during mitosis. (A,B) Immunofluorescence images of PtK1 cells (A) and HeLa cells (B) in various stages of mitosis. Enlarged images and insets in A and B show kinetochore pairs (indicated by the arrows). (C,D) Quantification of phosphorylated Aurora B kinase at the outer kinetochore during mitosis. For each mitotic phase or condition, a minimum of 100 kinetochores were measured from a total of at least 10 cells. (E) Immunofluorescence images of PtK1 cells (top) and HeLa cells (bottom) expressing Aurora-B-kinase–GFP (shown as ‘Aurora B kinase’ and in red for clarity) treated with or without 2 μM ZM447439 prior to fixation and stained with anti-Thr232-P Aurora B kinase antibodies (green). Insets in E show individual representative kinetochore pairs for each condition. Scale bars: 10 μm. Error bars indicate s.d.
Fig. 6.
Hec1 is not maximally rephosphorylated in response to lack of MT attachment. (A) Immunofluorescence images of control PtK1 and HeLa cells and cells treated with nocodazole prior to fixation. In the top panel of images, an example is given of a PtK1 cell that has a ‘compact’ morphology, indicating that at least partial chromosome alignment occurred prior to incubation with nocodazole, and one that has a ‘dispersed’ morphology, indicating that the cell entered mitosis in the presence of nocodazole. (B) Immunofluorescence images of a PtK1 cell with compact chromosomes treated with nocodazole and stained with an anti-Thr232-P Aurora B kinase antibody. Enlarged images in B show a representative kinetochore pair from this experiment. Scale bar: 10 μm.
Fig. 7.
Hec1 dephosphorylation by protein phosphatase 1. (A) Immunoblot of HeLa cell extracts treated with increasing concentrations of inhibitor 2 probed for Ser55-P. (B) Localization of GFP–PP1α and GFP–PP1γ in mitotic HeLa cells and in mitotic HeLa cells treated with nocodazole. (C) Quantification of kinetochore-localized GFP–PP1α and GFP–PP1γ. For each mitotic phase or condition, a minimum of 100 kinetochores were measured from a total of at least six cells. Error bars indicate s.d.
Similar articles
- Phosphorylation of microtubule-binding protein Hec1 by mitotic kinase Aurora B specifies spindle checkpoint kinase Mps1 signaling at the kinetochore.
Zhu T, Dou Z, Qin B, Jin C, Wang X, Xu L, Wang Z, Zhu L, Liu F, Gao X, Ke Y, Wang Z, Aikhionbare F, Fu C, Ding X, Yao X. Zhu T, et al. J Biol Chem. 2013 Dec 13;288(50):36149-59. doi: 10.1074/jbc.M113.507970. Epub 2013 Nov 1. J Biol Chem. 2013. PMID: 24187132 Free PMC article. - Dynamic acetylation of the kinetochore-associated protein HEC1 ensures accurate microtubule-kinetochore attachment.
Zhao G, Cheng Y, Gui P, Cui M, Liu W, Wang W, Wang X, Ali M, Dou Z, Niu L, Liu H, Anderson L, Ruan K, Hong J, Yao X. Zhao G, et al. J Biol Chem. 2019 Jan 11;294(2):576-592. doi: 10.1074/jbc.RA118.003844. Epub 2018 Nov 8. J Biol Chem. 2019. PMID: 30409912 Free PMC article. - Kinetochore microtubule dynamics and attachment stability are regulated by Hec1.
DeLuca JG, Gall WE, Ciferri C, Cimini D, Musacchio A, Salmon ED. DeLuca JG, et al. Cell. 2006 Dec 1;127(5):969-82. doi: 10.1016/j.cell.2006.09.047. Cell. 2006. PMID: 17129782 - Regulation of kinetochore-microtubule attachments by Aurora B kinase.
Liu D, Lampson MA. Liu D, et al. Biochem Soc Trans. 2009 Oct;37(Pt 5):976-80. doi: 10.1042/BST0370976. Biochem Soc Trans. 2009. PMID: 19754435 Review. - The Molecular Mechanism of Aurora-B Regulating Kinetochore-Microtubule Attachment in Mitosis and Oocyte Meiosis.
Chen S, Sun Q, Yao B, Ren Y. Chen S, et al. Cytogenet Genome Res. 2024;164(2):69-77. doi: 10.1159/000540588. Epub 2024 Jul 27. Cytogenet Genome Res. 2024. PMID: 39068909 Review.
Cited by
- Loss of BubR1 acetylation causes defects in spindle assembly checkpoint signaling and promotes tumor formation.
Park I, Lee HO, Choi E, Lee YK, Kwon MS, Min J, Park PG, Lee S, Kong YY, Gong G, Lee H. Park I, et al. J Cell Biol. 2013 Jul 22;202(2):295-309. doi: 10.1083/jcb.201210099. J Cell Biol. 2013. PMID: 23878276 Free PMC article. - Recent insights into the causes and consequences of chromosome mis-segregation.
Devillers R, Dos Santos A, Destombes Q, Laplante M, Elowe S. Devillers R, et al. Oncogene. 2024 Oct;43(43):3139-3150. doi: 10.1038/s41388-024-03163-5. Epub 2024 Sep 15. Oncogene. 2024. PMID: 39278989 Review. - Mitosis puts sisters in a strained relationship: force generation at the kinetochore.
Umbreit NT, Davis TN. Umbreit NT, et al. Exp Cell Res. 2012 Jul 15;318(12):1361-6. doi: 10.1016/j.yexcr.2012.04.008. Epub 2012 Apr 30. Exp Cell Res. 2012. PMID: 22564894 Free PMC article. Review. - Measuring NDC80 binding reveals the molecular basis of tension-dependent kinetochore-microtubule attachments.
Yoo TY, Choi JM, Conway W, Yu CH, Pappu RV, Needleman DJ. Yoo TY, et al. Elife. 2018 Jul 25;7:e36392. doi: 10.7554/eLife.36392. Elife. 2018. PMID: 30044223 Free PMC article. - MKLP2 functions in early mitosis to ensure proper chromosome congression.
Schrock MS, Scarberry L, Stromberg BR, Sears C, Torres AE, Tallman D, Krupinski L, Chakravarti A, Summers MK. Schrock MS, et al. J Cell Sci. 2022 Jun 15;135(12):jcs259560. doi: 10.1242/jcs.259560. Epub 2022 Jun 29. J Cell Sci. 2022. PMID: 35638575 Free PMC article.
References
- Andrews P. D., Ovechkina Y., Morrice N., Wagenbach M., Duncan K., Wordeman L., Swedlow J. R. (2004). Aurora B regulates MCAK at the mitotic centromere. Dev. Cell 6, 253-268 - PubMed
Publication types
MeSH terms
Substances
LinkOut - more resources
Full Text Sources
Other Literature Sources
Miscellaneous

