Incomplete lineage sorting patterns among human, chimpanzee, and orangutan suggest recent orangutan speciation and widespread selection - PubMed (original) (raw)
Incomplete lineage sorting patterns among human, chimpanzee, and orangutan suggest recent orangutan speciation and widespread selection
Asger Hobolth et al. Genome Res. 2011 Mar.
Abstract
We search the complete orangutan genome for regions where humans are more closely related to orangutans than to chimpanzees due to incomplete lineage sorting (ILS) in the ancestor of human and chimpanzees. The search uses our recently developed coalescent hidden Markov model (HMM) framework. We find ILS present in ∼1% of the genome, and that the ancestral species of human and chimpanzees never experienced a severe population bottleneck. The existence of ILS is validated with simulations, site pattern analysis, and analysis of rare genomic events. The existence of ILS allows us to disentangle the time of isolation of humans and orangutans (the speciation time) from the genetic divergence time, and we find speciation to be as recent as 9-13 million years ago (Mya; contingent on the calibration point). The analyses provide further support for a recent speciation of human and chimpanzee at ∼4 Mya and a diverse ancestor of human and chimpanzee with an effective population size of about 50,000 individuals. Posterior decoding infers ILS for each nucleotide in the genome, and we use this to deduce patterns of selection in the ancestral species. We demonstrate the effect of background selection in the common ancestor of humans and chimpanzees. In agreement with predictions from population genetics, ILS was found to be reduced in exons and gene-dense regions when we control for confounding factors such as GC content and recombination rate. Finally, we find the broad-scale recombination rate to be conserved through the complete ape phylogeny.
Figures
Figure 1.
(A) Probability of (in)congruence as a function of difference in speciation time τ. Consider the human–chimpanzee–gorilla triplet. With a speciation time difference of 2 million years (Myr), a generation time of 20 yr, and an effective human–chimpanzee population size of 50,000, we obtain an incongruence probability of 25%. Assuming a speciation time difference of 8 Myr for the human–chimpanzee–orangutan triplet, we obtain a congruence probability of 98.8%. Thus, the coalescent process predicts 1.2% lineage sorting between human, chimpanzee, and orangutan. (B) If the number of generations r between the speciation time of the three species and the speciation time of human and chimpanzee is small compared to the ancestral (effective) population size N of the human–chimpanzee common ancestor, then a gene from human and chimpanzee does not necessarily find common ancestry within the human–chimpanzee common ancestors. Here τ = t/(2_Ng_), where g is the generation time in years. (C) Average parameter estimates for the global analysis. (D) The mean time estimates for speciation for 21 autosomal chromosomes.
Figure 2.
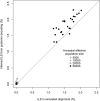
Inferred (from posterior decoding) versus expected (from simulations) amounts of ILS as a function of the human–chimp ancestral population size.
Figure 3.
(A) The distribution of fragment lengths supporting each of the four states. A geometric distribution (full line) is fitted to the observed distribution. (B) Examples of an alignment supporting the alternative [(H,O),C] genealogy. The top of the figure shows the posterior probability of being in the basic state (HC1) or in each of the three alternative states (HC2, HO, or CO). The bottom of the figure indicates informative sites and singletons.
Figure 4.
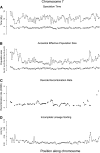
Example estimates along chromosome 7, divided into 131 chunks of 1 Mb of alignment. (A) Estimated speciation times for human–chimpanzee (squares) and human–orangutan (diamonds). (B) Estimated effective sizes of the human–chimpanzee ancestral species (squares) and the human–chimpanzee–orangutan ancestral species. (C) Average recombination rate for each chunk based on the deCODE map. (D) The percentage of incomplete lineage sorting estimated from posterior decoding.
Figure 5.
(A) Amount of ILS in introns and exons for each chromosome as a function of chromosome size. (B) ILS as a function of the deCODE recombination rate. (C) ILS as a function of average exon density of each chromosome. (D) ILS as a function of average intron density of each chromosome.
Similar articles
- Estimating divergence time and ancestral effective population size of Bornean and Sumatran orangutan subspecies using a coalescent hidden Markov model.
Mailund T, Dutheil JY, Hobolth A, Lunter G, Schierup MH. Mailund T, et al. PLoS Genet. 2011 Mar;7(3):e1001319. doi: 10.1371/journal.pgen.1001319. Epub 2011 Mar 3. PLoS Genet. 2011. PMID: 21408205 Free PMC article. - Linking great apes genome evolution across time scales using polymorphism-aware phylogenetic models.
De Maio N, Schlötterer C, Kosiol C. De Maio N, et al. Mol Biol Evol. 2013 Oct;30(10):2249-62. doi: 10.1093/molbev/mst131. Epub 2013 Aug 1. Mol Biol Evol. 2013. PMID: 23906727 Free PMC article. - Genomic relationships and speciation times of human, chimpanzee, and gorilla inferred from a coalescent hidden Markov model.
Hobolth A, Christensen OF, Mailund T, Schierup MH. Hobolth A, et al. PLoS Genet. 2007 Feb 23;3(2):e7. doi: 10.1371/journal.pgen.0030007. Epub 2006 Nov 30. PLoS Genet. 2007. PMID: 17319744 Free PMC article. - Lineage sorting in apes.
Mailund T, Munch K, Schierup MH. Mailund T, et al. Annu Rev Genet. 2014;48:519-35. doi: 10.1146/annurev-genet-120213-092532. Epub 2014 Sep 19. Annu Rev Genet. 2014. PMID: 25251849 Review. - The phylogeny of the hominoid primates, as indicated by DNA-DNA hybridization.
Sibley CG, Ahlquist JE. Sibley CG, et al. J Mol Evol. 1984;20(1):2-15. doi: 10.1007/BF02101980. J Mol Evol. 1984. PMID: 6429338 Review.
Cited by
- Parsimonious inference of hybridization in the presence of incomplete lineage sorting.
Yu Y, Barnett RM, Nakhleh L. Yu Y, et al. Syst Biol. 2013 Sep;62(5):738-51. doi: 10.1093/sysbio/syt037. Epub 2013 Jun 4. Syst Biol. 2013. PMID: 23736104 Free PMC article. - Importance of incomplete lineage sorting and introgression in the origin of shared genetic variation between two closely related pines with overlapping distributions.
Zhou Y, Duvaux L, Ren G, Zhang L, Savolainen O, Liu J. Zhou Y, et al. Heredity (Edinb). 2017 Mar;118(3):211-220. doi: 10.1038/hdy.2016.72. Epub 2016 Sep 21. Heredity (Edinb). 2017. PMID: 27649619 Free PMC article. - An evaluation of the hybrid speciation hypothesis for Xiphophorus clemenciae based on whole genome sequences.
Schumer M, Cui R, Boussau B, Walter R, Rosenthal G, Andolfatto P. Schumer M, et al. Evolution. 2013 Apr;67(4):1155-68. doi: 10.1111/evo.12009. Epub 2012 Dec 20. Evolution. 2013. PMID: 23550763 Free PMC article. - Effects of natural selection and gene conversion on the evolution of human glycophorins coding for MNS blood polymorphisms in malaria-endemic African populations.
Ko WY, Kaercher KA, Giombini E, Marcatili P, Froment A, Ibrahim M, Lema G, Nyambo TB, Omar SA, Wambebe C, Ranciaro A, Hirbo JB, Tishkoff SA. Ko WY, et al. Am J Hum Genet. 2011 Jun 10;88(6):741-754. doi: 10.1016/j.ajhg.2011.05.005. Am J Hum Genet. 2011. PMID: 21664997 Free PMC article. - Emerging Frontiers in the Study of Molecular Evolution.
Liberles DA, Chang B, Geiler-Samerotte K, Goldman A, Hey J, Kaçar B, Meyer M, Murphy W, Posada D, Storfer A. Liberles DA, et al. J Mol Evol. 2020 Apr;88(3):211-226. doi: 10.1007/s00239-020-09932-6. J Mol Evol. 2020. PMID: 32060574 Free PMC article.
References
- Begun DR 2005. Sivapithecus is east and Dryopithecus is west, and never the twain shall meet. Anthropol Sci 113: 53–64
- Burgess R, Yang Z 2008. Estimation of hominoid ancestral population sizes under Bayesian coalescent models incorporating mutation rate variation and sequencing errors. Mol Biol Evol 25: 1979–1994 - PubMed
- Chaimanee Y, Jolly D, Benammi M, Tafforeau P, Duzer D, Moussa I, Jaeger JJ 2003. A Middle Miocene hominoid from Thailand and orangutan origins. Nature 422: 61–65 - PubMed
Publication types
MeSH terms
Substances
LinkOut - more resources
Full Text Sources
Research Materials
Miscellaneous


