Immunoinhibitory adapter protein Src homology domain 3 lymphocyte protein 2 (SLy2) regulates actin dynamics and B cell spreading - PubMed (original) (raw)
Immunoinhibitory adapter protein Src homology domain 3 lymphocyte protein 2 (SLy2) regulates actin dynamics and B cell spreading
Max von Holleben et al. J Biol Chem. 2011.
Abstract
Appropriate B cell activation is essential for adaptive immunity. In contrast to the molecular mechanisms that regulate positive signaling in immune responses, the counterbalancing negative regulatory pathways remain insufficiently understood. The Src homology domain 3 (SH3)-containing adapter protein SH3 lymphocyte protein 2 (SLy2, also known as hematopoietic adapter-containing SH3 and sterile α-motif (SAM) domains 1; HACS1) is strongly up-regulated upon B cell activation and functions as an endogenous immunoinhibitor in vivo, but the underlying molecular mechanisms of SLy2 function have been elusive. We have generated transgenic mice overexpressing SLy2 in B and T cells and have studied the biological effects of elevated SLy2 levels in Jurkat and HeLa cells. Our results demonstrate that SLy2 induces Rac1-dependent membrane ruffle formation and regulates cell spreading and polarization and that the SLy2 SH3 domain is essential for these effects. Using immunoprecipitation and confocal microscopy, we provide evidence that the actin nucleation-promoting factor cortactin is an SH3 domain-directed interaction partner of SLy2. Consistent with an important role of SLy2 for actin cytoskeletal reorganization, we further show that SLy2-transgenic B cells are severely defective in cell spreading. Together, our findings extend our mechanistic understanding of the immunoinhibitory roles of SLy2 in vivo and suggest that the physiological up-regulation of SLy2 observed upon B cell activation functions to counteract excessive B cell spreading.
Figures
FIGURE 1.
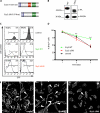
Overexpression of SLy2 inhibits cell proliferation. A, schematic representation of the SLy2 domain structure and the SLy2-ΔSH3 construct. aa, amino acids. B, Western blot analysis showing the expression of HA-tagged SLy2-WT (WT) and SLy2-ΔSH3 (Δ_SH3_) in HeLa cells. Blots were probed with anti-GAPDH antibodies as a loading control. C, Jurkat cells were transduced with SLy2-WT (IRES-GFP), SLy2-ΔSH3 (IRES-GFP), or GFP-only expression constructs. The percentage of GFP-positive cells (marker M1) was determined on day (d) 4 and day 18 or 27 after transduction and is indicated in each histogram. D, stably transduced HeLa cells expressing SLy2-WT, SLy2-ΔSH3, or a control construct were pulsed with BrdU, and the cellular BrdU content was monitored for 5 days (n = 4; two-way repeated measures ANOVA with Bonferroni's multiple comparison test: ***, p < 0.0001 for SLy2-WT compared with SLy2-ΔSH3). E, HeLa cells were transduced with the same expression constructs as in D. Cells were seeded onto coverslips, allowed to grow for 24 h, and were stained for F-actin. Shown are representative confocal laser scanning micrographs. Arrowheads indicate cellular extensions (scale bar, 10 μm).
FIGURE 2.
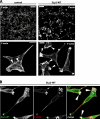
SLy2 affects actin dynamics. HeLa cells stably expressing HA-tagged SLy2-WT or a control vector were seeded onto coverslips and allowed to grow overnight. Subsequently, cells were fixed and stained for F-actin with phalloidin (A) or for F-actin and HA with α-HA-directed antibodies (B). HeLa cells overexpressing SLy2 show massive morphological changes. The upper panels display overview pictures (scale bar, 50 μm), and the lower panels show representative single cell images (scale bar, 10 μm). Arrowheads indicate cortical actin and stress fibers (lower left panel) or distal membrane ruffles (lower right panel). B, SLy2 (left panel) and F-actin (middle panel) colocalize in distal membrane ruffles (right panel, merged picture). Shown are confocal laser scanning microscopy images. The images were analyzed for colocalization with ImageJ and the colocalization RGB plug-in. Colocalized data points are displayed as white overlays (arrowheads). Images are representative of three independent experiments.
FIGURE 3.
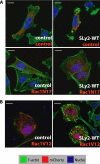
SLy2-mediated actin cytoskeletal reorganization in HeLa cells is dependent on Rac1 activity. A, expression of the dominant-negative Rac1-N17 mutant blocks SLy2 induced ruffle formation. HeLa cells expressing a control construct (left panels) or SLy2-WT (right panels) were transfected with either the mCherry vector alone (upper panels) or with a Rac1-N17 expression construct (lower panels). Transfected cells are marked by the red color indicative of mCherry expression. Cells grown on coverslips were fixed and stained for F-actin (green) and nuclei (blue). Dominant-negative Rac1 abolishes SLy2-induced ruffle formation. Scale bar, 10 μm. B, expression of the constitutively active Rac1-mutant Rac1-V12 enhances SLy2-dependent ruffle formation. Micrographs shown in A and B are confocal images representative of at least three independent experiments.
FIGURE 4.
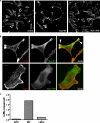
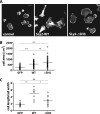
SLy2-SH3 domain is essential for SLy2-induced actin reorganization and ruffle formation. HeLa cells were transduced with the indicated expression constructs and were seeded onto coverslips. After growing for 24 h, the cells were fixed and stained for the HA-tagged SLy2 with anti-HA antibodies and for F-actin with phalloidin. A, low magnification overview images demonstrate that SLy2-ΔSH3 expressing cells display markedly fewer membrane ruffles but more stress fibers than the SLy2-WT-transduced cells (scale bar, 20 μm). B, single cell images were subjected to a per pixel colocalization analysis using the ImageJ colocalization RGB plug-in. Colocalized data points are displayed as white overlays (arrowheads). The extensive colocalization of SLy2 with F-actin is lost upon deletion of the SH3 domain (scale bar, 10 μm). Images in A and B are representative of at least three independent experiments. C, quantification of separate ruffling areas per cell in control, SLy2-WT-, or SLy2-ΔSH3-expressing cells. At least 58 cells in three independent experiments were scored.
FIGURE 5.
SLy2 interacts with cortactin via the SLy2-SH3 domain. A, homology-based search for SLy2-interacting proteins. A blast search with the SH3 domain of SLy2 was conducted using the NCBI data base. The left box depicts proteins whose SH3 domains are homologous to the SLy2-SH3 domain (the percentage of amino acid identity is indicated in parentheses). Subsequently, PubMed data base was searched for known interactors of these SH3 domains; the identified proteins are listed in the right boxes. B, candidate SLy2 binding partners identified in A were cloned into expression vectors containing a C-terminal Myc tag. Constructs were cotransfected together with a SLy2-WT expression plasmid into 293T cells, and SLy2 was immunoprecipitated using α-HA antibodies, and immunoprecipitates were tested for bound interactors by immunoblotting with α-Myc antibodies. Shown are only those candidates that could be coimmunoprecipitated with SLy2. Abbreviations are as follows: C_bl-b_, Casitas B-lineage lymphoma; RN-tre, Related to the N terminus of tre; SLP-65, SH2 domain-containing leukocyte protein of 65 kDa; SLP-76, SH2 domain-containing leukocyte protein of 76 kDa; Gab-1, Grb2-associated binder-1; CD2-IC domain, intracellular domain of CD2; IP, immunoprecipitation; IB, immunoblot. C, SLy2 coimmunoprecipitates with endogenous cortactin from HeLa (left panel) and Jurkat (right panel) cells. HeLa or Jurkat cells expressing HA-tagged SLy2-WT, SLy2-ΔSH3, or a control construct were lysed. SLy2 was precipitated with α-HA antibodies, and the immunoprecipitates were analyzed by Western blotting with α-cortactin antibodies. D, SLy2 colocalizes with endogenous cortactin in SLy2-WT-induced membrane ruffles. HeLa cells stably expressing HA-tagged SLy2-WT or SLy2-ΔSH3 were grown on coverslips, fixed, and stained with HA- and cortactin-specific antibodies. The confocal micrographs (optical slice thickness, 1 μm) were subjected to a per pixel colocalization analysis using the ImageJ colocalization finder plug-in. The lower panels represent enlargements of the boxed areas. The merged images (yellow color indicates overlap of red and green channels) also display colocalized data points (Pearson's correlation coefficient >90%) in white. Colocalized data points are also shown separately on the bottom right panels. The induction of membrane ruffles is markedly reduced upon expression of SLy2-ΔSH3, resulting in a more diffuse distribution of SLy2-ΔSH3 and cortactin (scale bar, 10 μm).
FIGURE 6.
SLy2 regulates cell spreading. A, HeLa cells transduced with the indicated constructs were resuspended and subsequently seeded onto gelatin-coated coverslips. The cells were allowed to adhere for 45 min before being fixed and stained for F-actin (scale bar, 20 μm). Compared with control cells, SLy2-WT expressors show a polarized morphology, whereas the morphology of SLy2-ΔSH3 expressing cells is isometric and resembles control cells. B, overexpression of SLy2-WT and SLy2-ΔSH3 increases the spread cell area. The cell area was determined using the ImageJ freehand circumference measurement and automated area analysis tool (two-way repeated measures ANOVA with Bonferroni's multiple comparison test, ***, p < 0.0001). ns, not significant. C, ratio of cell length to cell width was determined for at least 10 cells in each of three independent experiments (two-way repeated measures ANOVA with Bonferroni's multiple comparison test: **, p < 0.001; *, p < 0.01).
FIGURE 7.
Generation of transgenic mice with a T and B cell-specific expression of SLy2. A, complete open reading frame of SLy2 was cloned together with an HA tag into the BamHI site of p1026x, downstream of the chimeric promoter _lck-E_μ. This hybrid promoter assembled from the lck and the IgH genes directs transgene expression exclusively to T and B cells (17). The promoter is assembled from the lck proximal promoter (lck-prox) and the IgH enhancer (_E_μ). The arrow in the SLy2 ORF indicates the reading direction of the frame. Optimal expression of the SLy2 cDNA was ensured by a spliceable but nontranslatable expression cassette of the human growth hormone (hGX), located 3′ of the SLy2 cDNA. B, Northern blot analysis of total RNA from peripheral blood of four SLy2-transgenic mouse strains. The SLy2 cDNA was used as a probe. The different sizes likely originate from different splice variants with respect to the human growth hormone minigene in the 3′ end of the construct. The 18 S and 28 S rRNAs are shown as a loading control. C, expression of the HA-tagged SLy2 transgene in peripheral blood of four different mouse lines. Nucleated blood cells were depleted from erythrocytes with lympholyte M, lysed, and probed by Western blotting. D, expression of the SLy2 transgene in splenic B and T cells, in thymocytes and bone marrow cells (BM). Spleen cells from WT and transgenic animals were separated into B220− and B220+ fractions, lysed, and analyzed by Western blotting. Blots were probed for GAPDH as a loading control. IB, immunoblot.
FIGURE 8.
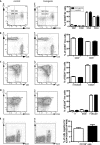
Flow cytometric analysis of lymphoid populations of SLy2-transgenic mice. Thymocytes, splenocytes, and bone marrow cells were isolated as detailed under “Experimental Procedures.” The analysis included the following: A, double-negative (DN) thymocytes; B, peripheral T cells; C, immature and mature peripheral B cells; D, transitional 1, marginal zone (MZB), and follicular B cells; and E, plasma cells. The cells were stained with the indicated fluorescently labeled antibodies and were analyzed on a FACS Canto II. The quantifications in the corresponding right panels combine the data of three independent experiments, each including five male and five female SLy2-transgenic or WT mice. No sex-dependent differences were observed for any of the tested parameters. The FACS data were evaluated with FlowJo software. SLy2-transgenic mice do not exhibit obvious defects in B or T cell development.
FIGURE 9.
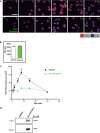
SLy2-transgenic splenocytes show impaired spreading to α-IgM-coated surfaces. A, control and SLy2-transgenic splenocytes were purified and MACS-sorted for B220 surface expression. Isolated splenic B cells were prestimulated for 1 h with α-CD40 and IL-4 and were allowed to settle to α-IgM-coated coverslips for 30 min on ice before being incubated at 37 °C for 30 min to induce spreading and contraction. Cells were then fixed at the indicated time points (_T_0–_T_30) and stained for F-actin. Shown are confocal micrographs; scale bar, 10 μm. B, FACS analysis demonstrates that IgM expression levels of control (white bar) and SLy2-transgenic (green bar) splenocytes are indistinguishable. MFI, mean fluorescence intensity. C, quantitative analysis of results shown in A. The spread cell area was determined for 30–50 cells at each time point. All data are representative of three independent experiments employing splenocytes from one male SLy2-transgenic or WT mouse and two female SLy2-transgenic or WT mice (Mann-Whitney rank sum test: ***, p < 0.001). D, SLy2 interacts with the lymphocytic cortactin homolog HS1. Murine splenocytes were isolated from control or SLy2-transgenic spleens as described. SLy2 was precipitated from lysates with α-HA and immunoprecipitates (IP) were analyzed with α-HS1 antibody.
Similar articles
- SLy2 controls the antibody response to pneumococcal vaccine through an IL-5Rα-dependent mechanism in B-1 cells.
Schmitt F, Schäll D, Bucher K, Schindler TI, Hector A, Biedermann T, Zemlin M, Hartl D, Beer-Hammer S. Schmitt F, et al. Eur J Immunol. 2015 Jan;45(1):60-70. doi: 10.1002/eji.201444882. Epub 2014 Nov 13. Eur J Immunol. 2015. PMID: 25330943 - SLy2 targets the nuclear SAP30/HDAC1 complex.
Brandt S, Ellwanger K, Beuter-Gunia C, Schuster M, Hausser A, Schmitz I, Beer-Hammer S. Brandt S, et al. Int J Biochem Cell Biol. 2010 Sep;42(9):1472-81. doi: 10.1016/j.biocel.2010.05.004. Epub 2010 May 15. Int J Biochem Cell Biol. 2010. PMID: 20478393 - SLy2-overexpression impairs B-cell development in the bone marrow and the IgG response towards pneumococcal conjugate-vaccine.
Jaufmann J, Tümen L, Beer-Hammer S. Jaufmann J, et al. Immun Inflamm Dis. 2021 Jun;9(2):533-546. doi: 10.1002/iid3.413. Epub 2021 Feb 16. Immun Inflamm Dis. 2021. PMID: 33592135 Free PMC article. - The atypical guanine nucleotide exchange factor Dock4 regulates neurite differentiation through modulation of Rac1 GTPase and actin dynamics.
Xiao Y, Peng Y, Wan J, Tang G, Chen Y, Tang J, Ye WC, Ip NY, Shi L. Xiao Y, et al. J Biol Chem. 2013 Jul 5;288(27):20034-45. doi: 10.1074/jbc.M113.458612. Epub 2013 May 17. J Biol Chem. 2013. PMID: 23720743 Free PMC article. - Nck/Dock: an adapter between cell surface receptors and the actin cytoskeleton.
Li W, Fan J, Woodley DT. Li W, et al. Oncogene. 2001 Oct 1;20(44):6403-17. doi: 10.1038/sj.onc.1204782. Oncogene. 2001. PMID: 11607841 Review.
Cited by
- Early and dynamic changes in gene expression in septic shock patients: a genome-wide approach.
Cazalis MA, Lepape A, Venet F, Frager F, Mougin B, Vallin H, Paye M, Pachot A, Monneret G. Cazalis MA, et al. Intensive Care Med Exp. 2014 Dec;2(1):20. doi: 10.1186/s40635-014-0020-3. Epub 2014 Aug 20. Intensive Care Med Exp. 2014. PMID: 26215705 Free PMC article. - Characterization of the role of Samsn1 loss in multiple myeloma development.
Friend NL, Hewett DR, Panagopoulos V, Noll JE, Vandyke K, Mrozik KM, Fitter S, Zannettino ACW. Friend NL, et al. FASEB Bioadv. 2020 Aug 5;2(9):554-572. doi: 10.1096/fba.2020-00027. eCollection 2020 Sep. FASEB Bioadv. 2020. PMID: 32923989 Free PMC article. - SAMSN1 is a tumor suppressor gene in multiple myeloma.
Noll JE, Hewett DR, Williams SA, Vandyke K, Kok C, To LB, Zannettino AC. Noll JE, et al. Neoplasia. 2014 Jul;16(7):572-85. doi: 10.1016/j.neo.2014.07.002. Neoplasia. 2014. PMID: 25117979 Free PMC article. - Whole Genome Sequence of Multiple Myeloma-Prone C57BL/KaLwRij Mouse Strain Suggests the Origin of Disease Involves Multiple Cell Types.
Amend SR, Wilson WC, Chu L, Lu L, Liu P, Serie D, Su X, Xu Y, Wang D, Gramolini A, Wen XY, O'Neal J, Hurchla M, Vachon CM, Colditz G, Vij R, Weilbaecher KN, Tomasson MH. Amend SR, et al. PLoS One. 2015 May 28;10(5):e0127828. doi: 10.1371/journal.pone.0127828. eCollection 2015. PLoS One. 2015. PMID: 26020268 Free PMC article. - New Regulatory roles for Human Serum Amyloid A.
García-Cortés CG, Parés-Matos EI. García-Cortés CG, et al. Int J Res Oncol. 2024;3(1):3249. Epub 2024 Apr 13. Int J Res Oncol. 2024. PMID: 39044740 Free PMC article.
References
- Pollard T. D., Borisy G. G. (2003) Cell 112, 453–465 - PubMed
- Fleire S. J., Goldman J. P., Carrasco Y. R., Weber M., Bray D., Batista F. D. (2006) Science 312, 738–741 - PubMed
- Harwood N. E., Batista F. D. (2008) Immunity 28, 609–619 - PubMed
- Vicente-Manzanares M., Sánchez-Madrid F. (2004) Nat. Rev. Immunol. 4, 110–122 - PubMed
Publication types
MeSH terms
Substances
LinkOut - more resources
Full Text Sources
Molecular Biology Databases
Research Materials
Miscellaneous
