Microbial community and metabolomic comparison of irritable bowel syndrome faeces - PubMed (original) (raw)
Microbial community and metabolomic comparison of irritable bowel syndrome faeces
Kannan Ponnusamy et al. J Med Microbiol. 2011 Jun.
Abstract
Human health relies on the composition of microbiota in an individual's gut and the synthesized metabolites that may alter the gut environment. Gut microbiota and faecal metabolites are involved in several gastrointestinal diseases. In this study, 16S rRNA-specific denaturing gradient gel electrophoresis and quantitative PCR analysis showed that the mean similarity of total bacteria was significantly different (P<0.001) in faecal samples from patients with irritable bowel syndrome (IBS; n = 11) and from non-IBS (nIBS) patients (n = 8). IBS subjects had a significantly higher diversity of total bacteria, as measured by the Shannon index (H') (3.36<H'<4.37, P = 0.004), Bacteroidetes and lactobacilli; however, less diversity was observed for Bifidobacter (1.7< H'<3.08, P<0.05) and Clostridium coccoides (0.9< H'<2.98, P = 0.007). In this study, no significant difference was found in total bacterial quantity (P>0.05). GC/MS-based multivariate analysis delineated the faecal metabolites of IBS from nIBS samples. Elevated levels of amino acids (alanine and pyroglutamic acid) and phenolic compounds (hydroxyphenyl acetate and hydroxyphenyl propionate) were found in IBS. These results were highly correlated with the abundance of lactobacilli and Clostridium, which indicates an altered metabolism rate associated with these gut micro-organisms. A higher diversity of Bacteroidetes and Lactobacillus groups in IBS faecal samples also correlated with the respective total quantity. In addition, these changes altered protein and carbohydrate energy metabolism in the gut.
Figures
Fig. 1.
Dice coefficient pairwise comparisons of total bacteria (using universal bacterial primers) and Bacteroidetes, Bifidobacterium, Clostridium coccoides and Lactobacillus groups in the IBS versus nIBS faecal community. *, P<0.05; **, P<0.001. White bars, nIBS; grey bars, IBS.
Fig. 2.
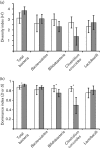
Diversity indices derived from DGGE fingerprinting of 16S rRNA gene-coding regions for total bacteria and the Bacteroidetes, Bifidobacterium, Clostridium coccoides and Lactobacillus groups. (a) Shannon index of general diversity (H′). (b) Simpson index of dominance (D or S). *, P<0.05; **, P<0.01. White bars, nIBS; grey bars, IBS.
Fig. 3.
Box and whisker plot showing the quantitative estimation of universal bacteria and group-specific bacteria determined by qPCR. IBS samples were compared with nIBS samples and the values were expressed as the mean log 16S rRNA gene copy number (g faeces)−1. The plot displays the following: mean (line inside the box; its position away from the centre represents the degree of skewness in the data),
sem
(±1 times large box) and
sd
(‘whiskers’ extending from the upper and lower edges). White bars, nIBS; grey bars, IBS.
Fig. 4.
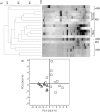
(a) Dendrogram showing the DGGE profiles of the IBS and nIBS faecal bacterial communities. Community DNA was detected by PCR amplification with universal bacterial 16S rRNA gene (V3–V5 regions) primers followed by DGGE. The dendrogram was constructed using _D_sc and the UPGMA algorithm. The arrow indicates the eluted band of Eubacterium biforme. (b) PCA of DGGE fingerprints of the 16S rRNA gene of dominant bacteria in IBS (□) and nIBS (▴) samples.
Fig. 5.
PLS-DA score plots (a) and PLS-DA loading S-plots (b) of significantly different metabolites derived from GC-MS analysis datasets of faecal extracts. (a) •, nIBS; ▴, IBS. (b) •, nIBS-related biomarkers; ▴, IBS-related biomarkers; ▪, unidentified biomarkers.
Fig. 6.
Hypothetical diagram showed a comparison of the faecal metabolites found and the major gut microbiota. The relative changes in IBS and nIBS faecal metabolites were derived from the GC-MS peak area and expressed as box and whisker plots. Positive and negative correlations are indicated as solid and dashed lines, respectively.
Similar articles
- Prevalence and temporal stability of selected clostridial groups in irritable bowel syndrome in relation to predominant faecal bacteria.
Maukonen J, Satokari R, Mättö J, Söderlund H, Mattila-Sandholm T, Saarela M. Maukonen J, et al. J Med Microbiol. 2006 May;55(Pt 5):625-633. doi: 10.1099/jmm.0.46134-0. J Med Microbiol. 2006. PMID: 16585652 - Differences in gut microbial composition correlate with regional brain volumes in irritable bowel syndrome.
Labus JS, Hollister EB, Jacobs J, Kirbach K, Oezguen N, Gupta A, Acosta J, Luna RA, Aagaard K, Versalovic J, Savidge T, Hsiao E, Tillisch K, Mayer EA. Labus JS, et al. Microbiome. 2017 May 1;5(1):49. doi: 10.1186/s40168-017-0260-z. Microbiome. 2017. PMID: 28457228 Free PMC article. - Diarrhoea-predominant irritable bowel syndrome distinguishable by 16S rRNA gene phylotype quantification.
Lyra A, Rinttilä T, Nikkilä J, Krogius-Kurikka L, Kajander K, Malinen E, Mättö J, Mäkelä L, Palva A. Lyra A, et al. World J Gastroenterol. 2009 Dec 21;15(47):5936-45. doi: 10.3748/wjg.15.5936. World J Gastroenterol. 2009. PMID: 20014457 Free PMC article. - Microbial and metabolomic profiles in correlation with depression and anxiety co-morbidities in diarrhoea-predominant IBS patients.
Liu T, Gu X, Li LX, Li M, Li B, Cui X, Zuo XL. Liu T, et al. BMC Microbiol. 2020 Jun 17;20(1):168. doi: 10.1186/s12866-020-01841-4. BMC Microbiol. 2020. PMID: 32552668 Free PMC article. - Gut microbial signatures of patients with diarrhea-predominant irritable bowel syndrome and their healthy relatives.
Chen J, Lan H, Li C, Xie Y, Cheng X, Xia R, Ke C, Liang X. Chen J, et al. J Appl Microbiol. 2024 Jun 3;135(6):lxae118. doi: 10.1093/jambio/lxae118. J Appl Microbiol. 2024. PMID: 38849305
Cited by
- The Efficacy of Probiotics Supplementation on the Quality of Life of Patients with Gastrointestinal Disease: A Systematic Review of Clinical Studies.
Moludi J, Saber A, Zozani MA, Moradi S, Azamian Y, Hajiahmadi S, Pasdar Y, Moradi F. Moludi J, et al. Prev Nutr Food Sci. 2024 Sep 30;29(3):237-255. doi: 10.3746/pnf.2024.29.3.237. Prev Nutr Food Sci. 2024. PMID: 39371511 Free PMC article. Review. - Modulating the gut microenvironment as a treatment strategy for irritable bowel syndrome: a narrative review.
Iribarren C, Maasfeh L, Öhman L, Simrén M. Iribarren C, et al. Gut Microbiome (Camb). 2022 Aug 25;3:e7. doi: 10.1017/gmb.2022.6. eCollection 2022. Gut Microbiome (Camb). 2022. PMID: 39295774 Free PMC article. Review. - Association of habitual sleep duration with abnormal bowel symptoms: a cross-sectional study of the 2005-2010 national health and nutrition examination survey.
Zhang G, Wang S, Ma P, Wang T, Sun X, Zhang X, Li H, Pan J. Zhang G, et al. J Health Popul Nutr. 2024 Aug 16;43(1):125. doi: 10.1186/s41043-024-00601-8. J Health Popul Nutr. 2024. PMID: 39152480 Free PMC article. - Predicting Disease-Metabolite Associations Based on the Metapath Aggregation of Tripartite Heterogeneous Networks.
Liu W, Lu P. Liu W, et al. Interdiscip Sci. 2024 Dec;16(4):829-843. doi: 10.1007/s12539-024-00645-8. Epub 2024 Aug 7. Interdiscip Sci. 2024. PMID: 39112911 - Diversity alone does not reliably indicate the healthiness of an animal microbiome.
Williams CE, Hammer TJ, Williams CL. Williams CE, et al. ISME J. 2024 Jan 8;18(1):wrae133. doi: 10.1093/ismejo/wrae133. ISME J. 2024. PMID: 39018234 Free PMC article. No abstract available.
References
- Apajalahti J. H., Särkilahti L. K., Mäki B. R., Heikkinen J. P., Nurminen P. H., Holben W. E. (1998). Effective recovery of bacterial DNA and percent-guanine-plus-cytosine-based analysis of community structure in the gastrointestinal tract of broiler chickens. Appl Environ Microbiol 64, 4084–4088 - PMC - PubMed
- Engberg R. M., Hedemann M. S., Leser T. D., Jensen B. B. (2000). Effect of zinc bacitracin and salinomycin on intestinal microflora and performance of broilers. Poult Sci 79, 1311–1319 - PubMed
Publication types
MeSH terms
Substances
LinkOut - more resources
Full Text Sources
Other Literature Sources
Medical
Molecular Biology Databases
Miscellaneous


