Characterizing the RNA targets and position-dependent splicing regulation by TDP-43 - PubMed (original) (raw)
doi: 10.1038/nn.2778. Epub 2011 Feb 27.
Tomaž Curk, Boris Rogelj, Michael Briese, Matteo Cereda, Melis Kayikci, Julian König, Tibor Hortobágyi, Agnes L Nishimura, Vera Zupunski, Rickie Patani, Siddharthan Chandran, Gregor Rot, Blaž Zupan, Christopher E Shaw, Jernej Ule
Affiliations
- PMID: 21358640
- PMCID: PMC3108889
- DOI: 10.1038/nn.2778
Characterizing the RNA targets and position-dependent splicing regulation by TDP-43
James R Tollervey et al. Nat Neurosci. 2011 Apr.
Abstract
TDP-43 is a predominantly nuclear RNA-binding protein that forms inclusion bodies in frontotemporal lobar degeneration (FTLD) and amyotrophic lateral sclerosis (ALS). The mRNA targets of TDP-43 in the human brain and its role in RNA processing are largely unknown. Using individual nucleotide-resolution ultraviolet cross-linking and immunoprecipitation (iCLIP), we found that TDP-43 preferentially bound long clusters of UG-rich sequences in vivo. Analysis of RNA binding by TDP-43 in brains from subjects with FTLD revealed that the greatest increases in binding were to the MALAT1 and NEAT1 noncoding RNAs. We also found that binding of TDP-43 to pre-mRNAs influenced alternative splicing in a similar position-dependent manner to Nova proteins. In addition, we identified unusually long clusters of TDP-43 binding at deep intronic positions downstream of silenced exons. A substantial proportion of alternative mRNA isoforms regulated by TDP-43 encode proteins that regulate neuronal development or have been implicated in neurological diseases, highlighting the importance of TDP-43 for the regulation of splicing in the brain.
Figures
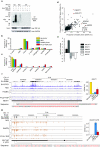
Figure 1. Comparison of TDP-43 RNA binding in healthy and FTLD-TDP brain
(a) To validate specificity of TDP-43 antibody for iCLIP, the 32P-labelled RNA bound to TDP-43 gel was isolated from control (Ctr) or knockdown (KD) HeLa cells in the presence or absence of UV crosslinking or anti-TDP-43 antibody. High and low RNase concentrations were used to confirm the presence of RNA bound to TDP-43. The arrows mark the positions on the gel corresponding to the size of TDP-43 monomer or dimer. TDP-43 Western analysis of input extracts confirmed TDP-43 knockdown, and GAPDH was used as a loading control. The full image is shown in Supplementary Fig. 1a**(b)** The proportion of cDNAs (out of all cDNAs that mapped to human genome) from the TDP-43 iCLIP experiments in the four types of samples that mapped to different RNA regions. (c) The proportion of cDNAs that mapped to different types of ncRNAs. (d) The proportion of cDNAs that mapped to individual RNAs with at least 10 cDNAs in any experiment. The RNAs with the largest significant change between control and FTLD-TDP brain (difference in proportion of cDNAs > 0.1% and p value < 0.05 by Student’s t-test, one-tailed, unequal variance) are marked in red. The long ncRNA MEG3 (maternally expressed 3) with the largest decrease in TDP-43 binding in FTLD-TDP is also marked. (e) Real-time PCR analysis of transcripts with largest TDP-43 iCLIP changes in total RNA isolated from control and FTLD-TDP brain samples. (f) iCLIP cDNA counts for TDP-43 crosslink positions in the NEAT1 gene in experiments from SH-SY5Y and hES cell lines, and healthy and FTLD-TDP tissue from different individuals. The blue bars represent sequences on the sense strand of the genome, and the height of the bars corresponds to the cDNA count. The positions of significant crosslink clusters (XL cluster) are shown on top, and the RNA sequence underlying the two man clusters is shown below, with UG repeats in pink. The graph shows the average proportion of cDNAs that map to NEAT1 transcript in each experiment (out of all cDNAs maping to the human genome), as well as standard deviation between experiments from different individuals. (g) iCLIP cDNA counts for TDP-43 crosslink positions in the SLC1A2 gene. The orange bars represent sequences on the antisense strand of the genome. The graph shows the average proportion of cDNAs that map to SLC1A2 3′ UTR in different experiments, as well as standard deviation between experiments from different individuals. The RNA sequence underlying the peak crosslinking sites is shown below, with UG repeats in pink.
Figure 2. TDP-43 binding motif analysis
(a) z-scores of penamer occurrence within the 61 nt sequence surrounding all crosslink sites (−30 nt to +30 nt) are shown for healthy and FTLD-TDP brain iCLIP. The sequences of the two most enriched pentamers and the Pearson correlation coefficient (r) between the two samples are given. (b) Enrichment of crosslinking compared to randomised data in UG repeats of different lengths in TDP-43 iCLIP experiments from healthy brains (blue) and FTLD-TDP brains (red), and CELF2 experiments in healthy brain (green). (d) Enrichment of crosslinking compared to randomised data on UG repeats of different lengths in TDP-43 iCLIP experiments from SH-SY5Y and hES cells, where we either included all crosslink sites (dark grey), or only those mapping to crosslink clusters (light grey). (e) Analysis of positions of UGUGU enrichment compared to randomised data around TDP-43 crosslink sites in healthy brains (blue) and FTLD-TDP brains (red), and CELF2 experiments in healthy brain (green). (e) Analysis of positions of UGUGU enrichment compared to randomised data in TDP-43 iCLIP experiments from SH-SY5Y and hES cells, where we either included all crosslink sites (dark grey), or only those mapping to crosslink clusters (light grey). (f) TDP-43 crosslinking in its own transcript (TARDBP). The replicate experiments are summed and shown in a single track. The RNA sequence underlying the peak crosslinking site is shown, with UG and GU dinucleotides in pink.
Figure 3. The RNA splicing map of TDP-43
The map of crosslink clusters at positions within 500 nt of alternative exons and flanking exons. The cassette exons with ΔIrank > 1 (enhanced exons, red clusters) or ΔIrank < −1 (silenced exons, blue clusters) with at least one crosslink cluster in these regions are shown. The exons are grouped by sequential analysis of crosslink cluster positions in three regions: group S1 is identified by clusters in region 1, 150nt upstream till the exon and within the exon; group S2 by clusters in region 2, 150–500nt downstream of the exon; and group E by clusters present 0–150nt downstream of the exon.
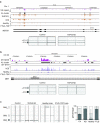
Figure 4. TDP-43 regulates splicing of non-coding and protein-coding RNAs
(a) TDP-43 crosslinking in MIAT ncRNA. UG repeat lengths are shown in pink bars and crosslink clusters are shown as black bars. Analysis of MIAT exon 10 inclusion (gel electropherogram, left, and quantification, right) in control and TDP-43 knockdown SH-SY5Y cells is shown below. (b) TDP-43 crosslinking in MEF2D protein-coding transcript. UG repeat lengths are shown in pink bars and crosslink clusters are shown as black bars. Analysis of MEF2D exon 11 inclusion (gel electropherogram, left, and quantification, right) in control and TDP-43 knockdown SH-SY5Y cells is shown below. (c) Analysis of BIM exon 3 splicing (gel electropherogram, left, and quantification, right) in control and TDP-43 knockdown SH-SY5Y cells, and in healthy (C23, C25, C30) and FTLD-TDP (F19, F20, F21) brain samples.
Comment in
- TDP-43: multiple targets, multiple disease mechanisms?
Sendtner M. Sendtner M. Nat Neurosci. 2011 Apr;14(4):403-5. doi: 10.1038/nn.2784. Nat Neurosci. 2011. PMID: 21445063 No abstract available. - Neurodegenerative disease: a target map for TDP43.
Whalley K. Whalley K. Nat Rev Neurosci. 2011 May;12(5):246. doi: 10.1038/nrn3032. Epub 2011 Apr 13. Nat Rev Neurosci. 2011. PMID: 21505508 No abstract available.
Similar articles
- TDP-43 and NOVA-1 RNA-binding proteins as competitive splicing regulators of the schizophrenia-associated TNIK gene.
Gumina V, Colombrita C, Fallini C, Bossolasco P, Maraschi AM, Landers JE, Silani V, Ratti A. Gumina V, et al. Biochim Biophys Acta Gene Regul Mech. 2019 Sep;1862(9):194413. doi: 10.1016/j.bbagrm.2019.194413. Epub 2019 Aug 2. Biochim Biophys Acta Gene Regul Mech. 2019. PMID: 31382054 Free PMC article. - Quantitative analysis of cryptic splicing associated with TDP-43 depletion.
Humphrey J, Emmett W, Fratta P, Isaacs AM, Plagnol V. Humphrey J, et al. BMC Med Genomics. 2017 May 26;10(1):38. doi: 10.1186/s12920-017-0274-1. BMC Med Genomics. 2017. PMID: 28549443 Free PMC article. - RNA targets of TDP-43 identified by UV-CLIP are deregulated in ALS.
Xiao S, Sanelli T, Dib S, Sheps D, Findlater J, Bilbao J, Keith J, Zinman L, Rogaeva E, Robertson J. Xiao S, et al. Mol Cell Neurosci. 2011 Jul;47(3):167-80. doi: 10.1016/j.mcn.2011.02.013. Epub 2011 Mar 21. Mol Cell Neurosci. 2011. PMID: 21421050 - TDP-43: a DNA and RNA binding protein with roles in neurodegenerative diseases.
Warraich ST, Yang S, Nicholson GA, Blair IP. Warraich ST, et al. Int J Biochem Cell Biol. 2010 Oct;42(10):1606-9. doi: 10.1016/j.biocel.2010.06.016. Epub 2010 Jun 25. Int J Biochem Cell Biol. 2010. PMID: 20601083 Review. - Long noncoding RNAs in TDP-43 and FUS/TLS-related frontotemporal lobar degeneration (FTLD).
Lourenco GF, Janitz M, Huang Y, Halliday GM. Lourenco GF, et al. Neurobiol Dis. 2015 Oct;82:445-454. doi: 10.1016/j.nbd.2015.07.011. Epub 2015 Jul 26. Neurobiol Dis. 2015. PMID: 26220395 Review.
Cited by
- Motor neuron translatome reveals deregulation of SYNGR4 and PLEKHB1 in mutant TDP-43 amyotrophic lateral sclerosis models.
Marques RF, Engler JB, Küchler K, Jones RA, Lingner T, Salinas G, Gillingwater TH, Friese MA, Duncan KE. Marques RF, et al. Hum Mol Genet. 2020 Sep 29;29(16):2647-2661. doi: 10.1093/hmg/ddaa140. Hum Mol Genet. 2020. PMID: 32686835 Free PMC article. - Transposable elements in TDP-43-mediated neurodegenerative disorders.
Li W, Jin Y, Prazak L, Hammell M, Dubnau J. Li W, et al. PLoS One. 2012;7(9):e44099. doi: 10.1371/journal.pone.0044099. Epub 2012 Sep 5. PLoS One. 2012. PMID: 22957047 Free PMC article. - An acetylation switch controls TDP-43 function and aggregation propensity.
Cohen TJ, Hwang AW, Restrepo CR, Yuan CX, Trojanowski JQ, Lee VM. Cohen TJ, et al. Nat Commun. 2015 Jan 5;6:5845. doi: 10.1038/ncomms6845. Nat Commun. 2015. PMID: 25556531 Free PMC article. - Dissecting the expression relationships between RNA-binding proteins and their cognate targets in eukaryotic post-transcriptional regulatory networks.
Nishtala S, Neelamraju Y, Janga SC. Nishtala S, et al. Sci Rep. 2016 May 10;6:25711. doi: 10.1038/srep25711. Sci Rep. 2016. PMID: 27161996 Free PMC article. - The role of TDP-43 mislocalization in amyotrophic lateral sclerosis.
Suk TR, Rousseaux MWC. Suk TR, et al. Mol Neurodegener. 2020 Aug 15;15(1):45. doi: 10.1186/s13024-020-00397-1. Mol Neurodegener. 2020. PMID: 32799899 Free PMC article. Review.
References
- Buratti E, Baralle FE. Multiple roles of TDP-43 in gene expression, splicing regulation, and human disease. Front Biosci. 2008;13:867–878. - PubMed
- Buratti E, Baralle FE. Characterization and functional implications of the RNA binding properties of nuclear factor TDP-43, a novel splicing regulator of CFTR exon 9. J Biol Chem. 2001;276:36337–36343. - PubMed
Publication types
MeSH terms
Substances
Grants and funding
- 089701/WT_/Wellcome Trust/United Kingdom
- 206726/ERC_/European Research Council/International
- MC_U105185858/MRC_/Medical Research Council/United Kingdom
- U.1051.04.028.00001.01 (85858)/MRC_/Medical Research Council/United Kingdom
LinkOut - more resources
Full Text Sources
Other Literature Sources
Molecular Biology Databases
Miscellaneous


