Structure of an agonist-bound human A2A adenosine receptor - PubMed (original) (raw)
Structure of an agonist-bound human A2A adenosine receptor
Fei Xu et al. Science. 2011.
Abstract
Activation of G protein-coupled receptors upon agonist binding is a critical step in the signaling cascade for this family of cell surface proteins. We report the crystal structure of the A(2A) adenosine receptor (A(2A)AR) bound to an agonist UK-432097 at 2.7 angstrom resolution. Relative to inactive, antagonist-bound A(2A)AR, the agonist-bound structure displays an outward tilt and rotation of the cytoplasmic half of helix VI, a movement of helix V, and an axial shift of helix III, resembling the changes associated with the active-state opsin structure. Additionally, a seesaw movement of helix VII and a shift of extracellular loop 3 are likely specific to A(2A)AR and its ligand. The results define the molecule UK-432097 as a "conformationally selective agonist" capable of receptor stabilization in a specific active-state configuration.
Figures
Fig. 1
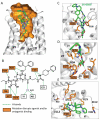
Ligand UK-432097 and its binding cavity. (A) Overall view of the ligand-binding cavity. The transmembrane part of A2AAR is shown as ribbon and colored gray (helices I to VII). Ligand UK-432097 is shown as bright green stick. For comparison, ligand ZM241385 (gray stick) is also shown at the position when the two complex structures were superimposed. The binding cavity is represented by orange surface (calculated with the program Hollow). Part of helix VII is removed for clarity. (B) Schematic representation of the hydrogen-bonding interactions (green dashed lines) between A2AAR and UK-432097. (C) Molecular interactions within the ligand-binding cavity for UK-432097 around the adenine moiety. Interacting residues are shown as sticks with side chains colored orange. Hydrogen bonds between A2AAR and ligand are shown as black dotted lines. (D) Molecular interactions around the ribose moiety. (E) Molecular interactions around the ligand substitution sites. A water molecule is shown as purple sphere. In (B)-(E), residue mutations reported to disrupt agonist and/or antagonist binding are indicated with orange squares. The images were created with PyMOL.
Fig. 2
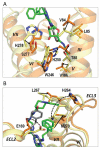
Ligand-binding cavity comparison between A2AAR/UK-432097 and A2AAR/ZM241385 complexes. Two receptors were superimposed using Cα atoms of the TM helices. UK-432097 bound A2AAR is colored orange (ribbon) with ligand colored green (stick), ZM241385 bound A2AAR (PDB ID: 3EML) is colored yellow (ribbon) with ligand colored gray (stick). (A) Comparison of the binding pocket around the ligand ribose moiety. Deviating residues (with either backbone or side-chain movement) are shown in sticks. The direction of movement is indicated by black arrows. For clarity, only helices III, VI, VII and part of helix V are shown. (B) Binding pocket comparison around the substitution part of the ligand. Prominent rotameric switches of Glu169 and His264 on ECL2 and ECL3, respectively, are indicated by dotted black arrows. The images were created with PyMOL.
Fig. 3
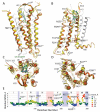
Analysis of conformational variations between A2AAR/UK-432097 (orange) and A2AAR/ZM241385 (yellow; PDB ID: 3EML) complexes. Two protein conformations were superimposed using Cα atoms of the TM helices. Heavy atom RMSDs were calculated for each residue of the receptor. (A) side view of helices I-IV; (B) side view of helices V-VIII; (C) extracellular (top) view; (D) intracellular (bottom) view. Most pronounced global changes in the TM helices are shown by black arrows. Side chains that change rotamer conformation are shown in sticks. (E) Plot showing individual residue deviations between superimposed A2AAR conformations, where each residue dot is also colored by deviation of its Cα atom (blue-green dots with high RMSD thus represent residues with rotamer switches). Regions of intracellular loops and helix VIII in the plot are shaded blue, the extracellular loops shaded pink. The images were created with ICM software (Molsoft LLC). Animated version of this figure can be found in Supporting Online Material.
Fig. 4
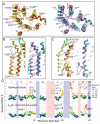
Comparison of conformational changes in A2AAR TM bundle between antagonist (yellow; ZM241385 PDB ID: 3EML) and agonist (orange; UK-432097) bound states to conformational changes in rhodopsin between inactive (cyan; PDB ID: 1GZM) and active-like (purple; PDB ID: 3DQB) states. The proteins were superimposed using Cα atoms of the TM helices. Side chains with switches in rotamer state and those critical for agonist interactions are shown in stick presentations. (A) Intracellular view on the 7TM helical bundle shown for A2AAR antagonist and agonist bound states on the left panel and for inactive Rhodopsin and active-like opsin on the right panel. (B) Comparison of movements in helices V and VI of A2AAR (yellow/orange) and Rho (cyan/purple). (C) Same for movements in helix VII. (D) Plot compares individual residue deviations in the 7TM bundle for A2AAR and Rhodopsin GPCRs; each residue dot is also colored by deviation of its Cα atom. Intracellular loops and helix VIII regions are shaded blue, extracellular loops shaded pink. The images were created with ICM software (Molsoft LLC).
Fig. 5
Modularity and common features of the activation mechanism in class A GPCRs. Relatively small agonist-specific conformational changes in the extracellular ligand binding module of the receptor (colored red) promote major rearrangements in the intracellular module (colored blue). The major changes include pronounced tilt of the intracellular parts of helices V (inward) and VI (outward), the latter combined with rotation, an inward tilt of the helix VII, as well as an axial shift of helix III. While the magnitude of changes observed in the three receptors, opsin, β2AR and A2AAR varies, the overall direction of each helix movements and their effect on reshaping of the G-protein binding site are similar. Note modularity between the “core” bundle of helices I-IV that changes the least, and a significantly more mobile module comprising helices V-VII. This architecture is reminiscent of antibodies, where a conserved two-domain framework is combined with complementarity determining regions (CDRs), or CDR loops to recognize a diverse array of molecules.
Similar articles
- Agonist-bound adenosine A2A receptor structures reveal common features of GPCR activation.
Lebon G, Warne T, Edwards PC, Bennett K, Langmead CJ, Leslie AG, Tate CG. Lebon G, et al. Nature. 2011 May 18;474(7352):521-5. doi: 10.1038/nature10136. Nature. 2011. PMID: 21593763 Free PMC article. - [Structure of the adenosine-bound conformation of the human adenosine A(2A) receptor].
Lebon G, Tate CG. Lebon G, et al. Med Sci (Paris). 2011 Nov;27(11):926-8. doi: 10.1051/medsci/20112711004. Epub 2011 Nov 30. Med Sci (Paris). 2011. PMID: 22130015 French. No abstract available. - Structural basis for allosteric regulation of GPCRs by sodium ions.
Liu W, Chun E, Thompson AA, Chubukov P, Xu F, Katritch V, Han GW, Roth CB, Heitman LH, IJzerman AP, Cherezov V, Stevens RC. Liu W, et al. Science. 2012 Jul 13;337(6091):232-6. doi: 10.1126/science.1219218. Science. 2012. PMID: 22798613 Free PMC article. - Structural insights into agonist-induced activation of G-protein-coupled receptors.
Deupi X, Standfuss J. Deupi X, et al. Curr Opin Struct Biol. 2011 Aug;21(4):541-51. doi: 10.1016/j.sbi.2011.06.002. Epub 2011 Jun 30. Curr Opin Struct Biol. 2011. PMID: 21723721 Review. - Agonist-bound structures of G protein-coupled receptors.
Lebon G, Warne T, Tate CG. Lebon G, et al. Curr Opin Struct Biol. 2012 Aug;22(4):482-90. doi: 10.1016/j.sbi.2012.03.007. Epub 2012 Apr 3. Curr Opin Struct Biol. 2012. PMID: 22480933 Review.
Cited by
- Structure-Guided Design of G-Protein-Coupled Receptor Polypharmacology.
Kampen S, Duy Vo D, Zhang X, Panel N, Yang Y, Jaiteh M, Matricon P, Svenningsson P, Brea J, Loza MI, Kihlberg J, Carlsson J. Kampen S, et al. Angew Chem Int Ed Engl. 2021 Aug 9;60(33):18022-18030. doi: 10.1002/anie.202101478. Epub 2021 Jul 16. Angew Chem Int Ed Engl. 2021. PMID: 33904641 Free PMC article. - Exploring binding properties of agonists interacting with a δ-opioid receptor.
Collu F, Ceccarelli M, Ruggerone P. Collu F, et al. PLoS One. 2012;7(12):e52633. doi: 10.1371/journal.pone.0052633. Epub 2012 Dec 26. PLoS One. 2012. PMID: 23300729 Free PMC article. - Tumor Immunotherapy Using A2A Adenosine Receptor Antagonists.
Zhang J, Yan W, Duan W, Wüthrich K, Cheng J. Zhang J, et al. Pharmaceuticals (Basel). 2020 Sep 8;13(9):237. doi: 10.3390/ph13090237. Pharmaceuticals (Basel). 2020. PMID: 32911819 Free PMC article. Review. - Mechanism of N-terminal modulation of activity at the melanocortin-4 receptor GPCR.
Ersoy BA, Pardo L, Zhang S, Thompson DA, Millhauser G, Govaerts C, Vaisse C. Ersoy BA, et al. Nat Chem Biol. 2012 Aug;8(8):725-30. doi: 10.1038/nchembio.1008. Epub 2012 Jun 24. Nat Chem Biol. 2012. PMID: 22729149 Free PMC article. - Advances in methods to characterize ligand-induced ionic lock and rotamer toggle molecular switch in G protein-coupled receptors.
Xie XQ, Chowdhury A. Xie XQ, et al. Methods Enzymol. 2013;520:153-74. doi: 10.1016/B978-0-12-391861-1.00007-1. Methods Enzymol. 2013. PMID: 23332699 Free PMC article.
References
- Rasmussen SG, et al. Nature. 2007;450:383. - PubMed
- Rosenbaum DM, et al. Science. 2007;318:1266. - PubMed
Publication types
MeSH terms
Substances
Grants and funding
- U54 GM094618/GM/NIGMS NIH HHS/United States
- P50 GM073197/GM/NIGMS NIH HHS/United States
- GM075915/GM/NIGMS NIH HHS/United States
- R01 GM075915/GM/NIGMS NIH HHS/United States
- Y1-GM-1104/GM/NIGMS NIH HHS/United States
- ImNIH/Intramural NIH HHS/United States
- R01 GM089857/GM/NIGMS NIH HHS/United States
- Y1-CO-1020/CO/NCI NIH HHS/United States
LinkOut - more resources
Full Text Sources
Other Literature Sources
Molecular Biology Databases
Research Materials


