Mapping the orientation of nuclear pore proteins in living cells with polarized fluorescence microscopy - PubMed (original) (raw)
Mapping the orientation of nuclear pore proteins in living cells with polarized fluorescence microscopy
Martin Kampmann et al. Nat Struct Mol Biol. 2011 Jun.
Abstract
The nuclear pore complex (NPC) perforates the nuclear envelope to facilitate selective transport between nucleus and cytoplasm. The NPC is composed of multiple copies of ∼30 different proteins, termed nucleoporins, whose arrangement within the NPC is an important unsolved puzzle in structural biology. Various alternative models for NPC architecture have been proposed but not tested experimentally in intact NPCs. We present a method using polarized fluorescence microscopy to investigate nucleoporin orientation in live yeast and mammalian cells. Our results support an arrangement of both yeast Nic96 and human Nup133-Nup107 in which their long axes are approximately parallel to the nuclear envelope plane. The method we developed can complement X-ray crystallography and electron microscopy to generate a high-resolution map of the entire NPC, and may be able to monitor nucleoporin rearrangements during nucleocytoplasmic transport and NPC assembly. This strategy can also be adapted for other macromolecular machines.
Conflict of interest statement
COMPETING FINANCIAL INTERESTS The authors declare no competing financial interests.
Figures
Figure 1
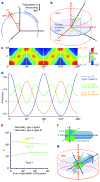
Fluorescence anisotropy patterns reflect the orientation of fluorophores within the NPC. (a) A circular nuclear envelope cross-section seen in the microscope coordinate system xyz. The polarization direction of the exciting light is parallel to y. The object plane is defined by xy, the optical axis by z. The nucleocytoplasmic axis N of each NPC is perpendicular to the plane tangential to the point in nuclear envelope at which the NPC is located. The angle between the y axis and N at a given point in the nuclear envelope is defined as γ. (b) An individual NPC with its own coordinate system NPQ. P is chosen to coincide with the optical axis z, PQ defines the nuclear envelope plane. The transition dipole of a fluorophore fixed within the NPC is μ. The orientation of μ within the NPC is described by α, the angle between μ and N, and β, the angle between P and the projection of μ onto the nuclear envelope plane PQ. (c) For a fluorophore with a given angle α, the anisotropy r can be predicted as a function of the nuclear envelope position γ. All functions r(γ) have a period of 180° (dashed line) and have mirror symmetry axes (dotted lines). (d) Anisotropy patterns along the nuclear envelope cross-section are shown for three values of α that exemplify different pattern types, as defined in the text. (e) The values of α at which transitions between pattern types occur were plotted as a function of the width of the Gaussian function with which the theoretical anisotropy pattern was convoluted to approximate the effect of experimental factors on the measured anisotropy values (see Supplementary Note). (f) Two perpendicular axes, u and v, are arbitrarily defined within the nucleoporin. For a given nucleoporin–GFP construct, the angle between u and the fluorophore transition dipole μ is designated ω; the angle between v and μ is θ. (g) The orientation of a nucleoporin within the NPC is characterized by two parameters: ψ, the angle between u and the nucleocytoplasmic axis N, and φ, the angle of rotation around u.
Figure 2
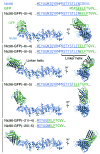
Nic96–GFP constructs with a continuous linker α-helix. Sequences of the budding yeast Nic96 C-terminus (blue) and of the GFP N-terminus (green) are shown with α-helical segments underlined. The C-terminal α-helix of Nic96 can be fused to the N-terminal α-helix of GFP such that a continuous linker helix connects the two moieties. Models of fusion proteins based on crystal structures of Nic96 (light blue) and GFP (green, with fluorophore in orange) are shown.
Figure 3
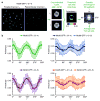
Polarized fluorescence microscopy reveals anisotropy patterns for yeast strains expressing Nic96–GFP constructs. (a) GFP-tagged yeast cells are excited with polarized light. Parallel and perpendicular components of the emitted light, _I_∥ and _I_⊥, are recorded simultaneously. Images of individual nuclei are cropped from the background-corrected micrographs and processed automatically as follows: _I_∥ and _I_⊥ images of the same nucleus are aligned and centered, and pixels not belonging to the nuclear envelope are masked by thresholding. An anisotropy image is calculated, and the average anisotropy is calculated within 32 sectors. (b) Experimental anisotropy curves for six Nic96–GFP constructs. Error bars represent the standard deviation of average sector anisotropy values from individual cells.
Figure 4
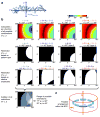
Analysis of anisotropy patterns reveals approximate orientation of Nic96 within the NPC. (a) Two axes are defined with respect to the crystallized domain of Nic96: The long axis u, and a perpendicular axis v. (b) First row: For each Nic96–GFP construct, θ and ω are derived from the molecular model. α is calculated for all possible combinations of ψ and φ. Second row: The experimental anisotropy patterns (Fig. 3b) were all type I, corresponding to a value of α < 42°. Combinations of ψ and φ values satisfying this condition are shown in white; incompatible combinations of ψ and φ are shown in black. Third row: Since the amplitude of type I patterns decreases as α increases between 0° and 42°, pairwise comparison of anisotropy curves with different amplitudes (Fig. 3b) further restricts the space of possible combinations of ψ and φ. Last row: All restrictions are combined to reveal the remaining space of possible ψ and φ values (white). (c) A value of ψ close to 90° is compatible with a published model in which Nic96 molecules were proposed to form a ring with their long axis perpendicular to the nucleocytoplasmic axis, as shown schematically here.
Figure 5
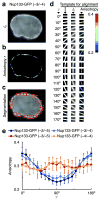
Anisotropy patterns in mammalian cells expressing Nup133–GFP. (a) _I_∥ image from polarized fluorescence microscopy of HeLa cell expressing Nup133–GFP (−3/−4). (b) Pseudocolored anisotropy image of the same cell. (c) 16×16 pixel boxes containing quasi-straight segments of nuclear envelope are selected. (d) Cross-correlation between the nuclear envelope segment and a series of template images is calculated to match the experimental image with the most similar template and thus determine the orientation of the nuclear envelope segment. First column: γ values. Second column: Corresponding synthetic template images. Third column: Average _I_∥ images of aligned segments from all Nup133–GFP (−3/−4) cells. Fourth column: Averaged anisotropy images of these segments. (e) Anisotropy curves obtained from segment analysis as outlined in (d), for 4 different Nup133–GFP constructs. Error bars represent the standard deviation of average segment anisotropy values from individual boxes.
Figure 6
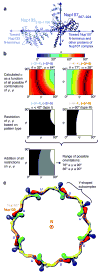
Nup133–GFP anisotropy patterns are consistent with the published “head-to-tail ring” arrangement of the Y-shaped subcomplex. (a) Two axes are defined with respect to the Nup133–Nup107 dimer: The long axis u connects the N-termini of the crystallized Nup107 and Nup133 domains, which connect to the remaining parts of the stem of the Y-shaped subcomplex. u should correspond approximately to the long axis of the entire subcomplex. The perpendicular axis v passes through the Nup133 C-terminus. (b) First row: For each Nup133–GFP construct, α was calculated for all possible combinations of ψ and φ. Second and last row: For constructs (−3/−4) and (−2/−5), Type I anisotropy patterns were observed (Fig. 5e), indicating α < 42°. For constructs (−4/−4) and (−3/−5), the Type III anisotropy patterns were observed (Fig. 5e), indicating α > 60°. Combinations of ψ and φ compatible with these restrictions are shown in white. (c) The anisotropy data indicates that the angle ψ between u, the long axis of the Nup107–Nup133 complex, and the nucleocytoplasmic axis N is closer to 90° than to 0°. This supports a model for the arrangement of the entire Y-shaped subcomplex in flat octameric head-to-tail rings. For illustrative purposes one such model was generated using the EM map of the homologous yeast Y-shaped complex and represents one subcomplex ring viewed along N. Colors indicate building blocks of the Y-shaped subcomplex: additional details are given in Supplementary Figure 6.
Similar articles
- Architecture of the linker-scaffold in the nuclear pore.
Petrovic S, Samanta D, Perriches T, Bley CJ, Thierbach K, Brown B, Nie S, Mobbs GW, Stevens TA, Liu X, Tomaleri GP, Schaus L, Hoelz A. Petrovic S, et al. Science. 2022 Jun 10;376(6598):eabm9798. doi: 10.1126/science.abm9798. Epub 2022 Jun 10. Science. 2022. PMID: 35679425 Free PMC article. - Architecture of the cytoplasmic face of the nuclear pore.
Bley CJ, Nie S, Mobbs GW, Petrovic S, Gres AT, Liu X, Mukherjee S, Harvey S, Huber FM, Lin DH, Brown B, Tang AW, Rundlet EJ, Correia AR, Chen S, Regmi SG, Stevens TA, Jette CA, Dasso M, Patke A, Palazzo AF, Kossiakoff AA, Hoelz A. Bley CJ, et al. Science. 2022 Jun 10;376(6598):eabm9129. doi: 10.1126/science.abm9129. Epub 2022 Jun 10. Science. 2022. PMID: 35679405 Free PMC article. - Mapping the native organization of the yeast nuclear pore complex using nuclear radial intensity measurements.
Vallotton P, Rajoo S, Wojtynek M, Onischenko E, Kralt A, Derrer CP, Weis K. Vallotton P, et al. Proc Natl Acad Sci U S A. 2019 Jul 16;116(29):14606-14613. doi: 10.1073/pnas.1903764116. Epub 2019 Jul 1. Proc Natl Acad Sci U S A. 2019. PMID: 31262825 Free PMC article. - Structure and Assembly of the Nuclear Pore Complex.
Hampoelz B, Andres-Pons A, Kastritis P, Beck M. Hampoelz B, et al. Annu Rev Biophys. 2019 May 6;48:515-536. doi: 10.1146/annurev-biophys-052118-115308. Epub 2019 Apr 3. Annu Rev Biophys. 2019. PMID: 30943044 Review. - Functional architecture of the nuclear pore complex.
Grossman E, Medalia O, Zwerger M. Grossman E, et al. Annu Rev Biophys. 2012;41:557-84. doi: 10.1146/annurev-biophys-050511-102328. Annu Rev Biophys. 2012. PMID: 22577827 Review.
Cited by
- Dsg2 ectodomain organization increases throughout desmosome assembly.
Dean WF, Albert RM, Nawara TJ, Ubil M, Beggs RR, Mattheyses AL. Dean WF, et al. Cell Adh Migr. 2024 Dec;18(1):1-13. doi: 10.1080/19336918.2024.2333366. Epub 2024 Apr 2. Cell Adh Migr. 2024. PMID: 38566311 Free PMC article. - Extending fluorescence anisotropy to large complexes using reversibly switchable proteins.
Volpato A, Ollech D, Alvelid J, Damenti M, Müller B, York AG, Ingaramo M, Testa I. Volpato A, et al. Nat Biotechnol. 2023 Apr;41(4):552-559. doi: 10.1038/s41587-022-01489-7. Epub 2022 Oct 10. Nat Biotechnol. 2023. PMID: 36217028 Free PMC article. - Defining domain-specific orientational order in the desmosomal cadherins.
Dean WF, Mattheyses AL. Dean WF, et al. Biophys J. 2022 Nov 15;121(22):4325-4341. doi: 10.1016/j.bpj.2022.10.009. Epub 2022 Oct 12. Biophys J. 2022. PMID: 36225113 Free PMC article. - Conformation of the nuclear pore in living cells is modulated by transport state.
Pulupa J, Prior H, Johnson DS, Simon SM. Pulupa J, et al. Elife. 2020 Dec 21;9:e60654. doi: 10.7554/eLife.60654. Elife. 2020. PMID: 33346731 Free PMC article. - Linear Dichroism Measurements for the Study of Protein-DNA Interactions.
Takahashi M, Norden B. Takahashi M, et al. Int J Mol Sci. 2023 Nov 8;24(22):16092. doi: 10.3390/ijms242216092. Int J Mol Sci. 2023. PMID: 38003280 Free PMC article. Review.
References
- Beck M, Lucic V, Forster F, Baumeister W, Medalia O. Snapshots of nuclear pore complexes in action captured by cryo-electron tomography. Nature. 2007;449:611–5. - PubMed
- Alber F, et al. The molecular architecture of the nuclear pore complex. Nature. 2007;450:695–701. - PubMed
Publication types
MeSH terms
Substances
LinkOut - more resources
Full Text Sources
Other Literature Sources
Molecular Biology Databases
Miscellaneous
