NF-kappaB dysregulation in microRNA-146a-deficient mice drives the development of myeloid malignancies - PubMed (original) (raw)
NF-kappaB dysregulation in microRNA-146a-deficient mice drives the development of myeloid malignancies
Jimmy L Zhao et al. Proc Natl Acad Sci U S A. 2011.
Abstract
MicroRNA miR-146a has been implicated as a negative feedback regulator of NF-κB activation. Knockout of the miR-146a gene in C57BL/6 mice leads to histologically and immunophenotypically defined myeloid sarcomas and some lymphomas. The sarcomas are transplantable to immunologically compromised hosts, showing that they are true malignancies. The animals also exhibit chronic myeloproliferation in their bone marrow. Spleen and marrow cells show increased transcription of NF-κB-regulated genes and tumors have higher nuclear p65. Genetic ablation of NF-κB p50 suppresses the myeloproliferation, showing that dysregulation of NF-κB is responsible for the myeloproliferative disease.
Conflict of interest statement
Conflict of interest statement: D.B. is a member of the board of directors and M.P.B. and K.D.T. are employees of Regulus Therapeutics Inc., a company developing microRNA-based therapeutics.
Figures
Fig. 1.
miR-146a–deficient mice develop myeloid and lymphoid malignancies. Mice were 18- to 22-mo-old miR-146a−/− mice (KO) and sex- and age-matched C57BL/6 control mice (WT). (A) Incidences of myeloid and lymphoid malignancies observed in wild-type (n = 39) and KO (n = 43) mice. (B) Photograph, FACS plot, and histological analysis of a representative myeloid tumor from a KO spleen. Panels 3 and 4 show an H&E-stained spleen section. [Scale bars, (Left) 100 μm; (Right) 40 μm.] Arrows, mitotic figures. (C) Photograph, FACS plot, and histological analysis of a representative B-cell lymphoma from a KO gastrointestinal tract. Panels 3 and 5 show an H&E-stained tumor section; panel 4 shows positive immunohistochemical staining for B220 [Scale bars, (Left to Right) 100 μm in panels 3 and 4 and 40 μm in panel 5.] (D) Photograph, FACS plot, and histological analysis of a representative mixed T- and B-cell lymphoma from a KO liver. Panels 3–5 show H&E-stained liver sections. Lym, Lymphoma; Liv, relatively uninvolved liver. [Scale bars (Left to Right) are 400 μm, 100 μm, and 40 μm.]
Fig. 2.
Myeloid sarcoma is transplantable into immunocompromised Rag2−/−γC−/− recipient mice, causing lethal myeloid pathology. WT designates Rag2−/−γC−/− mice transplanted with wild-type splenocytes; KO designates Rag2−/−γC−/− mice transplanted with miR-146a KO splenocytes (n = 4 for wild-type and n = 4 for KO; data are representative of three independent experiments). (A) Representative bioluminiscence images of Rag2−/−γC−/− recipient mice splenic side view. (B) Quantification of whole-body bioluminiscence intensity from splenic side view of one representative experiment. Vertical axis is in logarithmic scale. Transduction efficiency is determined by flow cytometric analysis of GFP+ cells before injection. The bioluminescence intensity is normalized to the percentage of initially transduced cells. (C) Spleen weight of Rag2−/−γC−/− recipient mice (Student t test, *P < 0.05). (D) Photographs of spleens, kidneys, and livers from representative Rag2−/−γC−/− recipient mice. (E) Flow cytometric analysis of myeloid cells (defined as CD11b+) in representative recipient kidneys and livers. SSC, side scatter.
Fig. 3.
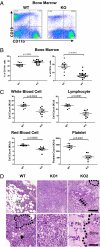
Chronic myeloproliferation and myelofibrosis occur in miR-146a–deficient bone marrow. Mice were 18- to 22-mo-old miR-146a−/− mice (KO) and sex- and age-matched wild-type control mice (WT). Data are shown as Mean ± SEM. Each individual dot represents one individual mouse. (A) Flow cytometric analysis of nucleated bone marrow cells from one representative wild-type mouse and one representative KO mouse for B cells (defined as CD19+) and myeloid cells (defined as CD11b+). (B) Percentage of B cells (defined as CD19+) and myeloid cells (defined as CD11b+) in nucleated bone marrow cells by flow cytometric analysis (n = 12 for WT and n = 17 for KO from at least three independent experiments). (C) Absolute numbers of total white blood cells, lymphocytes, red blood cells, and platelets by complete blood count analysis (n = 8 for WT and n = 8 for KO). (D) Representative H&E-stained tibia sections from KO mice showing myelofibrosis and wild-type control. WT, wild-type bone marrow; adi, adipose tissue. KO1, markedly hypercellular KO bone marrow that contains virtually no megakaryocytres (arrowhead, Lower Left) or erythroid islands (outlined by dashed line, Lower Left). KO2: fibrotic KO bone marrow; arrows in the Upper Right, a broad band of fibrosis, of which there are many in this field; within the dotted line, an area of new bone formation that may represent end-stage fibrosis; (Lower Right) the interface between an area of fibrosis (fib) with entrapped myeloid cells and new bone formation (bone). [Scale bars, (Upper) 200 microns; (Lower) 40 μm.]
Fig. 4.
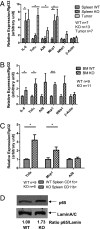
Spleen and bone marrow cells from miR-146a–deficient mice (KO) show increased activation of the NF-κB–mediated transcription. Mice were 18- to 22-mo-old miR-146a−/− mice (KO) and sex- and age-matched wild-type control mice (WT). Data are shown as mean ± SEM. n represents the number of mice analyzed from at least two independent experiments. Student t test, *P < 0.05, ***P < 0.005. (A) Gene-expression analysis of NF-κB–responsive genes in wild-type (n = 7) nucleated splenocytes, KO (n = 13) nucleated splenocytes, and myeloid tumor cells (Tumor, n = 7) isolated from KO spleen by gross dissection. (B) Gene-expression analysis of NF-κB–responsive genes in wild-type (n = 9) and KO (n = 11) bone marrow cells. (C) Gene-expression analysis of NF-κB–responsive genes in CD11b+ population purified with MACS beads (WT n = 9 and KO n = 6). (D) Western blot analysis of the nuclear protein extracts from wild-type or KO spleen. Data are representative of three independent experiments.
Fig. 5.
Reduction in the NF-κB level by deleting the p50 subunit of NF-κB effectively rescues the myeloproliferative phenotype in miR-146a–deficient mice. All mice were 6- to 7-mo-old miR-146a+/+, p50+/+ (WT), miR-146a−/−, p50+/+ (miRKO), miR-146a−/−, p50+/− (miRKO p50HET), or miR-146a−/−, p50−/− (DKO) mice (n = 17 for WT, n = 24 miRKO, n = 10 for miRKO p50HET, and n = 9 for DKO). Data are shown as mean ± SEM from at least three independent experiments. Student t test, *P < 0.05, **P < 0.01, and ***P < 0.005. (A) Spleen weight of wild-type, miRKO, miRKO p50HET, and DKO mice. (B) Percentage of T cells (defined as CD3ε+), B cells (defined as CD19+), myeloid cells (defined as CD11b+), and erythroid cells (defined as Ter119+) in nucleated spleen and bone marrow cells from wild-type, miRKO, miRKO p50HET, and DKO mice by flow cytometric analysis.
Similar articles
- Myeloid cell-targeted miR-146a mimic inhibits NF-κB-driven inflammation and leukemia progression in vivo.
Su YL, Wang X, Mann M, Adamus TP, Wang D, Moreira DF, Zhang Z, Ouyang C, He X, Zhang B, Swiderski PM, Forman SJ, Baltimore D, Li L, Marcucci G, Boldin MP, Kortylewski M. Su YL, et al. Blood. 2020 Jan 16;135(3):167-180. doi: 10.1182/blood.2019002045. Blood. 2020. PMID: 31805184 Free PMC article. - Pacritinib prevents inflammation-driven myelofibrosis-like phenotype in a miR-146a-/- murine model.
Cuenca-Zamora EJ, Martínez C, Morales ML, Guijarro-Carrillo PJ, López-Poveda MJ, Alcolea-Guardiola C, Vidal-Garrido N, Lozano ML, Gonzalez-Conejero R, Teruel-Montoya R, Ferrer-Marín F. Cuenca-Zamora EJ, et al. Biomed Pharmacother. 2024 Dec;181:117712. doi: 10.1016/j.biopha.2024.117712. Epub 2024 Nov 26. Biomed Pharmacother. 2024. PMID: 39603040 - An NF-κB-microRNA regulatory network tunes macrophage inflammatory responses.
Mann M, Mehta A, Zhao JL, Lee K, Marinov GK, Garcia-Flores Y, Lu LF, Rudensky AY, Baltimore D. Mann M, et al. Nat Commun. 2017 Oct 11;8(1):851. doi: 10.1038/s41467-017-00972-z. Nat Commun. 2017. PMID: 29021573 Free PMC article. - Ablation of miR-146b in mice causes hematopoietic malignancy.
Mitsumura T, Ito Y, Chiba T, Matsushima T, Kurimoto R, Tanaka Y, Kato T, Uchida K, Ito T, Yamamoto K, Eishi Y, Kitagawa M, Miyazaki Y, Inase N, Asahara H. Mitsumura T, et al. Blood Adv. 2018 Dec 11;2(23):3483-3491. doi: 10.1182/bloodadvances.2018017954. Blood Adv. 2018. PMID: 30530754 Free PMC article. - MicroRNA-146a modulates B-cell oncogenesis by regulating Egr1.
Contreras JR, Palanichamy JK, Tran TM, Fernando TR, Rodriguez-Malave NI, Goswami N, Arboleda VA, Casero D, Rao DS. Contreras JR, et al. Oncotarget. 2015 May 10;6(13):11023-37. doi: 10.18632/oncotarget.3433. Oncotarget. 2015. PMID: 25906746 Free PMC article.
Cited by
- miRNA expression and function in thyroid carcinomas: a comparative and critical analysis and a model for other cancers.
Saiselet M, Pita JM, Augenlicht A, Dom G, Tarabichi M, Fimereli D, Dumont JE, Detours V, Maenhaut C. Saiselet M, et al. Oncotarget. 2016 Aug 9;7(32):52475-52492. doi: 10.18632/oncotarget.9655. Oncotarget. 2016. PMID: 27248468 Free PMC article. Review. - miR-146a controls the resolution of T cell responses in mice.
Yang L, Boldin MP, Yu Y, Liu CS, Ea CK, Ramakrishnan P, Taganov KD, Zhao JL, Baltimore D. Yang L, et al. J Exp Med. 2012 Aug 27;209(9):1655-70. doi: 10.1084/jem.20112218. Epub 2012 Aug 13. J Exp Med. 2012. PMID: 22891274 Free PMC article. - Pseudomonas aeruginosa infection augments inflammation through miR-301b repression of c-Myb-mediated immune activation and infiltration.
Li X, He S, Li R, Zhou X, Zhang S, Yu M, Ye Y, Wang Y, Huang C, Wu M. Li X, et al. Nat Microbiol. 2016 Aug 8;1(10):16132. doi: 10.1038/nmicrobiol.2016.132. Nat Microbiol. 2016. PMID: 27670114 Free PMC article. - Type 2 Diabetes Monocyte MicroRNA and mRNA Expression: Dyslipidemia Associates with Increased Differentiation-Related Genes but Not Inflammatory Activation.
Baldeón R L, Weigelt K, de Wit H, Ozcan B, van Oudenaren A, Sempértegui F, Sijbrands E, Grosse L, van Zonneveld AJ, Drexhage HA, Leenen PJ. Baldeón R L, et al. PLoS One. 2015 Jun 17;10(6):e0129421. doi: 10.1371/journal.pone.0129421. eCollection 2015. PLoS One. 2015. PMID: 26083362 Free PMC article. - Our Journey from the Study of Human Autoantibodies to the microRNA World.
Fredenburg KM, Chan EK. Fredenburg KM, et al. Front Immunol. 2015 Mar 11;6:110. doi: 10.3389/fimmu.2015.00110. eCollection 2015. Front Immunol. 2015. PMID: 25814992 Free PMC article. Review. No abstract available.
References
- O'Connell RM, Rao DS, Chaudhuri AA, Baltimore D. Physiological and pathological roles for microRNAs in the immune system. Nat Rev Immunol. 2010;10:111–122. - PubMed
- Xiao C, Rajewsky K. MicroRNA control in the immune system: Basic principles. Cell. 2009;136:26–36. - PubMed
- Calin GA, Croce CM. MicroRNA signatures in human cancers. Nat Rev Cancer. 2006;6:857–866. - PubMed
Publication types
MeSH terms
Substances
Grants and funding
- 5R01AI079243-02/AI/NIAID NIH HHS/United States
- 5K08CA133521/CA/NCI NIH HHS/United States
- K08 CA133521/CA/NCI NIH HHS/United States
- K99 HL102228/HL/NHLBI NIH HHS/United States
- 5K99HL102228/HL/NHLBI NIH HHS/United States
- R01 AI079243/AI/NIAID NIH HHS/United States
LinkOut - more resources
Full Text Sources
Other Literature Sources
Molecular Biology Databases
Research Materials


