Genotype and SNP calling from next-generation sequencing data - PubMed (original) (raw)
Review
Genotype and SNP calling from next-generation sequencing data
Rasmus Nielsen et al. Nat Rev Genet. 2011 Jun.
Abstract
Meaningful analysis of next-generation sequencing (NGS) data, which are produced extensively by genetics and genomics studies, relies crucially on the accurate calling of SNPs and genotypes. Recently developed statistical methods both improve and quantify the considerable uncertainty associated with genotype calling, and will especially benefit the growing number of studies using low- to medium-coverage data. We review these methods and provide a guide for their use in NGS studies.
Conflict of interest statement
Competing interests statement
The authors declare no competing financial interests.
Figures
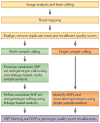
Figure 1. Steps for converting raw next-generation sequencing data into a final set of SNP or genotype calls
Pre-processing steps (shown in yellow) transform the raw data from next-generation sequencing technology into a set of aligned reads that have a measure of confidence, or quality score, associated with the bases of each read. The per-base quality scores produced by base-calling algorithms may need to be recalibrated to accurately reflect the true error rates. Depending on the number of samples and the depth of coverage, either a multi-sample calling procedure (green) or a single-sample calling procedure (orange) may then be applied to obtain SNP or genotype calls and associated quality scores. Note that the multi-sample procedure may include a linkage-based analysis, which can substantially improve the accuracy of SNP or genotype calls. Finally, post-processing (purple) uses both known data and simple heuristics to filter the set of SNPs and/or improve the associated quality scores. Optional, although recommended, steps are shown in dashed lines.
Figure 2. A comparison of three genotype callers
A subset of the data (chromosome 20, bases 20,000,000–25,000,000) for the 62 CEU individuals in both the HapMap Public Release no. 28 and the 1000 Genomes Pilot Project was genotype-called using the following methods: GATK Unified Genotyper, applied to each individual independently (blue); GATK Unified Genotyper applied to all individuals collectively (red); and GATK Unified Genotyper applied to all individuals collectively, followed by Beagle using linkage disequilibrium (LD) information for genotype calling (black). For each of several quality thresholds, genotype calls with quality greater than the threshold were compared to HapMap data. Every such threshold thus entails both a proportion of called HapMap data and accuracy, relative to HapMap. For high call rates, genotyping the individuals collectively and using the LD-based method Beagle provided marked improvements.
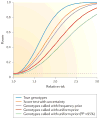
Figure 3. The power of association mapping for next-generation sequencing data
Simulations of the power to detect association (_p_-value <0.05; dashed line) using various approaches for genotype calling at a 5% significance level. For each effect size, 50,000 simulations were performed for 1,000 cases and 1,000 controls assuming a population minor allele frequency (MAF) of 1% and a disease prevalence of 10%. The individual depth was simulated assuming a Poisson distribution with mean coverage of 4× and the sequence reads were sampled from the true genotypes, assuming an error rate of 1%. Genotype probabilities were calculated either by assuming a uniform genotype prior (red and light green) or by using the inferred MAF and Hardy–Weinberg equilibrium (purple and orange). Genotypes were called based on either the highest genotype probability (red and purple) or only for genotypes with a posterior-genotype probability (PP) >95% (light green). The called genotypes were tested using logistic regression, whereas the score statistic used the probability of the genotype, and therefore effectively integrates over the uncertainty in the genotype calls.
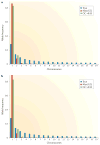
Figure 4. The site frequency spectrum in next-generation sequencing data
Fifty megabases of sequence were simulated for 50 individuals assuming a mean (Poisson-distributed) sequencing depth of 4× per individual, a per-site error rate of 0.003 and that 2% of all sites were variable. Because of the presence of missing data for one method, the data for all methods were subsampled down to a sample size of 20 chromosomes, using only called genotypes. Panels a and b show the site frequency spectrum (SFS) for all sites and for sites with a probability of harbouring a SNP of >95%, respectively. Both panels show the true SFS (True), the SFS using genotype calls (GC) obtained by always choosing the genotype with the highest posterior probability (Max (GC)), and when only calling genotypes with a posterior probability of >95% (GC >0.95). Notice that genotype-based inferences tend to overestimate the amount of singletons. The excess of singletons can be reduced or eliminated by using priors, or filtering processes, that are biased against singletons. However, such procedures will typically tend to introduce other biases.
Similar articles
- Estimation of allele frequency and association mapping using next-generation sequencing data.
Kim SY, Lohmueller KE, Albrechtsen A, Li Y, Korneliussen T, Tian G, Grarup N, Jiang T, Andersen G, Witte D, Jorgensen T, Hansen T, Pedersen O, Wang J, Nielsen R. Kim SY, et al. BMC Bioinformatics. 2011 Jun 11;12:231. doi: 10.1186/1471-2105-12-231. BMC Bioinformatics. 2011. PMID: 21663684 Free PMC article. - A statistical framework for SNP calling, mutation discovery, association mapping and population genetical parameter estimation from sequencing data.
Li H. Li H. Bioinformatics. 2011 Nov 1;27(21):2987-93. doi: 10.1093/bioinformatics/btr509. Epub 2011 Sep 8. Bioinformatics. 2011. PMID: 21903627 Free PMC article. - Coverage-based consensus calling (CbCC) of short sequence reads and comparison of CbCC results to identify SNPs in chickpea (Cicer arietinum; Fabaceae), a crop species without a reference genome.
Azam S, Thakur V, Ruperao P, Shah T, Balaji J, Amindala B, Farmer AD, Studholme DJ, May GD, Edwards D, Jones JD, Varshney RK. Azam S, et al. Am J Bot. 2012 Feb;99(2):186-92. doi: 10.3732/ajb.1100419. Epub 2012 Feb 1. Am J Bot. 2012. PMID: 22301893 - The extent of linkage disequilibrium and computational challenges of single nucleotide polymorphisms in genome-wide association studies.
Huang YT, Chang CJ, Chao KM. Huang YT, et al. Curr Drug Metab. 2011 Jun;12(5):498-506. doi: 10.2174/138920011795495312. Curr Drug Metab. 2011. PMID: 21453276 Review. - Definition and clinical importance of haplotypes.
Crawford DC, Nickerson DA. Crawford DC, et al. Annu Rev Med. 2005;56:303-20. doi: 10.1146/annurev.med.56.082103.104540. Annu Rev Med. 2005. PMID: 15660514 Review.
Cited by
- An integrative variant analysis pipeline for accurate genotype/haplotype inference in population NGS data.
Wang Y, Lu J, Yu J, Gibbs RA, Yu F. Wang Y, et al. Genome Res. 2013 May;23(5):833-42. doi: 10.1101/gr.146084.112. Epub 2013 Jan 7. Genome Res. 2013. PMID: 23296920 Free PMC article. - On Estimation of Allele Frequencies via Next-Generation DNA Resequencing with Barcoding.
Lee JS, Zhao H. Lee JS, et al. Stat Biosci. 2013 May 1;5(1):26-53. doi: 10.1007/s12561-013-9084-y. Stat Biosci. 2013. PMID: 23730349 Free PMC article. - Challenges in quantifying genome erosion for conservation.
Bosse M, van Loon S. Bosse M, et al. Front Genet. 2022 Sep 26;13:960958. doi: 10.3389/fgene.2022.960958. eCollection 2022. Front Genet. 2022. PMID: 36226192 Free PMC article. Review. - Computational pan-genomics: status, promises and challenges.
Computational Pan-Genomics Consortium. Computational Pan-Genomics Consortium. Brief Bioinform. 2018 Jan 1;19(1):118-135. doi: 10.1093/bib/bbw089. Brief Bioinform. 2018. PMID: 27769991 Free PMC article. Review. - Estimation of site frequency spectra from low-coverage sequencing data using stochastic EM reduces overfitting, runtime, and memory usage.
Rasmussen MS, Garcia-Erill G, Korneliussen TS, Wiuf C, Albrechtsen A. Rasmussen MS, et al. Genetics. 2022 Nov 30;222(4):iyac148. doi: 10.1093/genetics/iyac148. Genetics. 2022. PMID: 36173322 Free PMC article.
References
- Metzker M. Sequencing technologies — the next generation. Nature Rev Genet. 2010;11:31–46. This article provides an excellent Review of NGS technologies and their applications. - PubMed
Publication types
MeSH terms
Grants and funding
- T32 HG000047/HG/NHGRI NIH HHS/United States
- R01-HG003229-05/HG/NHGRI NIH HHS/United States
- R01 HG003229/HG/NHGRI NIH HHS/United States
- R01-HG003229-0551/HG/NHGRI NIH HHS/United States
- T32-HG00047/HG/NHGRI NIH HHS/United States
LinkOut - more resources
Full Text Sources
Other Literature Sources


