A HIF-regulated VHL-PTP1B-Src signaling axis identifies a therapeutic target in renal cell carcinoma - PubMed (original) (raw)
. 2011 Jun 1;3(85):85ra47.
doi: 10.1126/scitranslmed.3002004.
Elsa Vanhecke, Katelyn M Atkins, Manuela Graf, Katherine Swabey, Paul Huang, Peter Schraml, Holger Moch, Amy Mulick Cassidy, Daniel Brewer, Bissan Al-Lazikani, Paul Workman, Johann De-Bono, Stan B Kaye, James Larkin, Martin E Gore, Charles L Sawyers, Peter Nelson, Tomasz M Beer, Hao Geng, Lina Gao, David Z Qian, Joshi J Alumkal, Gary Thomas, George V Thomas
Affiliations
- PMID: 21632985
- PMCID: PMC3303496
- DOI: 10.1126/scitranslmed.3002004
A HIF-regulated VHL-PTP1B-Src signaling axis identifies a therapeutic target in renal cell carcinoma
Natsuko Suwaki et al. Sci Transl Med. 2011.
Abstract
Metastatic renal cell carcinoma (RCC) is a molecularly heterogeneous disease that is intrinsically resistant to chemotherapy and radiotherapy. Although therapies targeted to the molecules vascular endothelial growth factor and mammalian target of rapamycin have shown clinical effectiveness, their effects are variable and short-lived, underscoring the need for improved treatment strategies for RCC. Here, we used quantitative phosphoproteomics and immunohistochemical profiling of 346 RCC specimens and determined that Src kinase signaling is elevated in RCC cells that retain wild-type von Hippel-Lindau (VHL) protein expression. RCC cell lines and xenografts with wild-type VHL exhibited sensitivity to the Src inhibitor dasatinib, in contrast to cell lines that lacked the VHL protein, which were resistant. Forced expression of hypoxia-inducible factor (HIF) in RCC cells with wild-type VHL diminished Src signaling output by repressing transcription of the Src activator protein tyrosine phosphatase 1B (PTP1B), conferring resistance to dasatinib. Our results suggest that a HIF-regulated VHL-PTP1B-Src signaling pathway determines the sensitivity of RCC to Src inhibitors and that stratification of RCC patients with antibody-based profiling may identify patients likely to respond to Src inhibitors in RCC clinical trials.
Figures
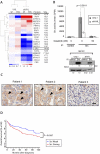
Figure 1. Src is expressed in RCC and is associated with poor outcome
A. Lysates from parallel cultures of serum-stimulated SN12C and SN12C-shVHL cells were labeled with iTRAQ 8-plex reagent and phosphotyrosine-containing peptides were subjected to immobilized metal affinity chromatography-tandem MS analysis. Quantitative phosphorylation profiles were generated for 22 phosphorylation sites. Mean ratios to SN12C control were log transformed and partitioned according to similarity of phosphorylation status by unsupervised, hierarchical clustering using Cluster 3.0 (54) and visualized with TreeView (55). Heatmap is pseudo-colored to indicate direction and magnitude of mean ratios relative to SN12C control cells. SF, serum free; FBS, fetal bovine serum). See also table S1 and Methods. B. Src was immunoprecipitated from SN12C and SN12C shVHL cells and Src kinase activity was measured in the absence or presence of 50 nM dasatinib as described in methods. Data are presented as the mean CPM ± S.D. from three independent experiments assayed in duplicate. (Lower panel) Corresponding western blot showing control (no primary antibody) or Src immunoprecipitates and relative Src expression in SN12C and SN12C-shVHL cells. The amount of Src was quantified with Image J and presented numerically as the fold-change. C. Immunohistochemistry for Src from samples from 3 representative RCC patients with strong (left and center panels) or weak expression (right panel). Arrowheads indicate membranous localization. Scale bar, 20 μm. D. Kaplan-Meier survival analysis of clear cell RCC patients with tumors expressing weak or strong Src immunohistochemical staining (n = 117, p = 0.0367).
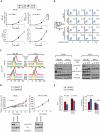
Figure 2. Dasatinib induces growth arrest in VHL-WT RCC cells
A. 5×10⁴ VHL-WT (VHL+) SN12C and ACHN or shVHL cells were treated with vehicle, 25, 50 or 100 nM dasatinib 24h after-seeding. Effect of dasatinib on cell growth was monitored by cell count at indicated time points (n = 3). Data are presented as the mean ± S.D. B. Sub-confluent SN12C and ACHN VHL-WT (VHL+) or shVHL cells were treated with the indicated doses of dasatinib for 48h and labeled with 10 μM BrdU for 30 min prior to harvesting. Cells were dual-stained with FITC-BrdU antibody and PI and analyzed by flow cytometry. C. Sub-confluent SN12C and ACHN VHL-WT (VHL+) or shVHL cells were treated with vehicle, 25, 50 or 100 nM dasatinib. Inhibitory effect of dasatinib on Src kinase activity was assessed by flow cytometry using anti-pY419 Src (left panel). Levels of total and phospho-specific forms of Src and FAK were determined by immunoblotting. α-tubulin (right panel), loading control. D. Nude mice bearing SN12C and SN12C shVHL xenografts were treated daily with vehicle or 10 mg/kg of dasatinib by oral gavage. Fold increase in tumor volume is plotted against days following tumor injection. Xenografts were analyzed by immunoblot for levels of pSrc Y419 and total Src. α-tubulin, loading control. Data are presented as the mean ± S.E.M. of six mice in each group. E. Xenograft tumors from (D) were analyzed for cell proliferation and apoptosis by immunohistochemistry against Ki-67 and cleaved-caspase-3, respectively and subjected to quantitative image analysis. Data are presented as the mean ± S.E.M. (n = 11–21).
Figure 3. Src is the relevant target of dasatinib in RCC
A. SN12C, SN12C-shSrc or SN12C-shSrc cells expressing v-Src (Rescue) were treated with vehicle, 25, 50 or 100 nM dasatinib for 96h and then cell growth was analyzed by cell count. Data are presented as the mean ± S.D. (n = 3). Src expression or knockdown was verified by immunoblot with antibodies against total and pY419 Src. α-tubulin, loading control. B, C. SN12C cells (Control) or SN12C cells stably expressing (B) dasatinib-resistant Src (Src T338I), or (C) v-Src, were treated with vehicle alone or with 25 or 50 nM dasatinib for 96h and then cell growth was analyzed by cell count. Data are presented as the mean ± S.D. (n = 3). The levels of total Src and pY419 Src were assessed by immunoblot. α-tubulin and β-actin, loading controls. D. SCID mice bearing SN12C and SN12C v-Src xenografts were treated daily with vehicle or 10 mg/kg of dasatinib by oral gavage. Percent (%) increase in tumor volume is plotted against days following tumor injection. Data are presented as the mean ± S.E.M. (n = 24).
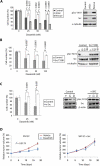
Figure 4. HIF-α and PTP1B are involved in dasatinib-induced growth inhibition
A. SN12C and ACHN cells stably expressing mutant HIF-1α (P564A) or HIF-2α (P405A; P853A) were treated with vehicle, 25, 50 or 100 nM dasatinib for 96h and then cell growth was analyzed by cell count. Data are presented as the mean ± S.D. (n = 3, **p<0.01). Overexpression of the mutant forms of HIF-α were validated by immunoblot. α-tubulin, loading control. B. SN12C and ACHN cells stably expressing mutant HIF-1α (P564A) or HIF-2α (P405A; P853A) were treated with vehicle, 25, 50 or 100 nM dasatinib for 48h and then analyzed for BrdU incorporation by flow cytometry as described in Methods. C. SN12C and ACHN cells stably expressing constitutively stable HIF-1α P564A (SN12C HIF-1α) or HIF-2α P405A; P853A (SN12C HIF-2α) were treated with vehicle alone or with, 25, 50 or 100 nM dasatinib for 18h. Levels of total Src and FAK as well as pSrc Y419 and pFAK Y576/577 were determined by immunoblot. α-tubulin, loading control. D. Lysates from the SN12C and ACHN mutant HIF-α overexpressing lines, shVHL cells and the parental cell lines were examined for expression of total and/or phospho-specific forms of Src, FAK, ERK1/2, STAT3, CSK and PTP1B by immunoblot. α-tubulin, loading control. E. The levels of PTP1B mRNA were measured by real-time PCR in SN12C and ACHN HIF-α overexpressing and shVHL cell lines. Levels of PTP1B mRNA in the parental cell lines were normalized to 1. Data are presented as the mean ± S.D. (n = 3). F. SN12C cells expressing an shRNA targeting PTP1B (shPTP1B) were analyzed by immunoblot for expression levels of total and/or phospho-specific forms of PTP1B, Src, FAK, STAT3, ERK1/2 and α-tubulin. G. SN12C or shPTP1B cells were treated with vehicle, 25, 50 or 100 nM dasatinib and cell growth was assessed by cell count**.** Data are presented as the mean ± S.D. (n = 3).
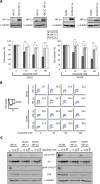
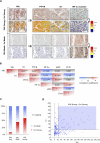
Figure 5. Demonstration of inter-relationships between VHL, HIF-α, Src and PTP1B in RCC patients
A. Quantitative assessment of VHL, PTP1B, Src and HIF-2α expression by immunostaining of RCC TMA. Representative staining images from a patient with strong VHL protein expression (top panel) and from a patient with weak VHL expression (bottom panel) are shown. Corresponding markup images of the color deconvolution algorithm with intensity ranges are shown (Red = strong, orange = moderate, yellow = weak, blue = negative immunoreactivity). For HIF-2α, the nuclear immunostaining algorithm was applied. Scale bar is 50 μm. B. Spearman Rho correlation coefficients among the biomarkers are listed in the boxes. Red indicates positive correlation and blue indicates negative correlation. P values for these correlations are represented as follows: *p<0.05; **p<0.001; ***p<0.0001 (n = 136). C. Comparison between Src and VHL protein expression in the RCC tissue microarray D. Scatter plot of the VHL and Src scores generated from automated image analysis intensity algorithm. The vertical lines represent 5th percentile and median VHL scores, corresponding to thresholds for negative and weak expression, respectively. The horizontal line represents the median for the Src score, where levels below are considered weak expression and levels above are considered strong expression. The upper right (shaded) quadrant depicts the molecular phenotype of tumors with both strong VHL and strong Src expression.
Similar articles
- Mutations of the von Hippel-Lindau gene confer increased susceptibility to natural killer cells of clear-cell renal cell carcinoma.
Perier A, Fregni G, Wittnebel S, Gad S, Allard M, Gervois N, Escudier B, Azzarone B, Caignard A. Perier A, et al. Oncogene. 2011 Jun 9;30(23):2622-32. doi: 10.1038/onc.2010.638. Epub 2011 Jan 24. Oncogene. 2011. PMID: 21258414 - MicroRNAs Associated with Von Hippel-Lindau Pathway in Renal Cell Carcinoma: A Comprehensive Review.
Schanza LM, Seles M, Stotz M, Fosselteder J, Hutterer GC, Pichler M, Stiegelbauer V. Schanza LM, et al. Int J Mol Sci. 2017 Nov 22;18(11):2495. doi: 10.3390/ijms18112495. Int J Mol Sci. 2017. PMID: 29165391 Free PMC article. Review. - Significance of PI3K signalling pathway in clear cell renal cell carcinoma in relation to VHL and HIF status.
Tumkur Sitaram R, Landström M, Roos G, Ljungberg B. Tumkur Sitaram R, et al. J Clin Pathol. 2021 Apr;74(4):216-222. doi: 10.1136/jclinpath-2020-206693. Epub 2020 May 28. J Clin Pathol. 2021. PMID: 32467322 Review.
Cited by
- Cabozantinib and dasatinib synergize to induce tumor regression in non-clear cell renal cell carcinoma.
Lue HW, Derrick DS, Rao S, Van Gaest A, Cheng L, Podolak J, Lawson S, Xue C, Garg D, White R 3rd, Ryan CW, Drake JM, Ritz A, Heiser LM, Thomas GV. Lue HW, et al. Cell Rep Med. 2021 May 7;2(5):100267. doi: 10.1016/j.xcrm.2021.100267. eCollection 2021 May 18. Cell Rep Med. 2021. PMID: 34095877 Free PMC article. - Src family kinases, adaptor proteins and the actin cytoskeleton in epithelial-to-mesenchymal transition.
Ortiz MA, Mikhailova T, Li X, Porter BA, Bah A, Kotula L. Ortiz MA, et al. Cell Commun Signal. 2021 Jun 30;19(1):67. doi: 10.1186/s12964-021-00750-x. Cell Commun Signal. 2021. PMID: 34193161 Free PMC article. Review. - Targeting Src family kinases in anti-cancer therapies: turning promise into triumph.
Zhang S, Yu D. Zhang S, et al. Trends Pharmacol Sci. 2012 Mar;33(3):122-8. doi: 10.1016/j.tips.2011.11.002. Epub 2011 Dec 9. Trends Pharmacol Sci. 2012. PMID: 22153719 Free PMC article. Review. - SETD2 loss-of-function promotes renal cancer branched evolution through replication stress and impaired DNA repair.
Kanu N, Grönroos E, Martinez P, Burrell RA, Yi Goh X, Bartkova J, Maya-Mendoza A, Mistrík M, Rowan AJ, Patel H, Rabinowitz A, East P, Wilson G, Santos CR, McGranahan N, Gulati S, Gerlinger M, Birkbak NJ, Joshi T, Alexandrov LB, Stratton MR, Powles T, Matthews N, Bates PA, Stewart A, Szallasi Z, Larkin J, Bartek J, Swanton C. Kanu N, et al. Oncogene. 2015 Nov 12;34(46):5699-708. doi: 10.1038/onc.2015.24. Epub 2015 Mar 2. Oncogene. 2015. PMID: 25728682 Free PMC article. - The Differential Impact of SRC Expression on the Prognosis of Patients with Head and Neck Squamous Cell Carcinoma.
Hermida-Prado F, Granda-Díaz R, Del-Río-Ibisate N, Villaronga MÁ, Allonca E, Garmendia I, Montuenga LM, Rodríguez R, Vallina A, Alvarez-Marcos C, Rodrigo JP, García-Pedrero JM. Hermida-Prado F, et al. Cancers (Basel). 2019 Oct 25;11(11):1644. doi: 10.3390/cancers11111644. Cancers (Basel). 2019. PMID: 31731442 Free PMC article.
References
- Gupta K, Miller JD, Li JZ, Russell MW, Charbonneau C. Epidemiologic and socioeconomic burden of metastatic renal cell carcinoma (mRCC): a literature review. Cancer Treat Rev. 2008 May;34:193. - PubMed
- Janzen NK, Kim HL, Figlin RA, Belldegrun AS. Surveillance after radical or partial nephrectomy for localized renal cell carcinoma and management of recurrent disease. Urol Clin North Am. 2003 Nov;30:843. - PubMed
- Lam JS, Leppert JT, Figlin RA, Belldegrun AS. Surveillance following radical or partial nephrectomy for renal cell carcinoma. Curr Urol Rep. 2005 Feb;6:7. - PubMed
- Bonsib SM. Renal cystic diseases and renal neoplasms: a mini-review. Clin J Am Soc Nephrol. 2009 Dec;4:1998. - PubMed
Publication types
MeSH terms
Substances
Grants and funding
- C309/A8274/CRUK_/Cancer Research UK/United Kingdom
- UL1 RR024140-06/RR/NCRR NIH HHS/United States
- R01 DK037274-25/DK/NIDDK NIH HHS/United States
- T32 GM071338-04/GM/NIGMS NIH HHS/United States
- CA151564/CA/NCI NIH HHS/United States
- R01 DK037274/DK/NIDDK NIH HHS/United States
- R01 CA149253/CA/NCI NIH HHS/United States
- P30 CA069533-13S5/CA/NCI NIH HHS/United States
- DK37274/DK/NIDDK NIH HHS/United States
- KL2 RR024141/RR/NCRR NIH HHS/United States
- P30 CA069533 13S5/CA/NCI NIH HHS/United States
- P30 CA 069533/CA/NCI NIH HHS/United States
- P30 CA069533/CA/NCI NIH HHS/United States
- R01 CA151564/CA/NCI NIH HHS/United States
- T32 GM71338/GM/NIGMS NIH HHS/United States
- 1KL2 RR024141 01/RR/NCRR NIH HHS/United States
- T32 GM071338-05/GM/NIGMS NIH HHS/United States
- R01CA149253-01/CA/NCI NIH HHS/United States
- R01 CA149253-01/CA/NCI NIH HHS/United States
- KL2 RR024141-01/RR/NCRR NIH HHS/United States
- R01 DK037274-24S1/DK/NIDDK NIH HHS/United States
- T32 GM071338/GM/NIGMS NIH HHS/United States
- R01 CA151564-01A1/CA/NCI NIH HHS/United States
- UL1 RR024140/RR/NCRR NIH HHS/United States
- R01 DK037274-24/DK/NIDDK NIH HHS/United States
- P30 CA069533-13/CA/NCI NIH HHS/United States
- 11566/CRUK_/Cancer Research UK/United Kingdom
LinkOut - more resources
Full Text Sources
Other Literature Sources
Miscellaneous
