Epithelial membrane protein-2 promotes endometrial tumor formation through activation of FAK and Src - PubMed (original) (raw)
Epithelial membrane protein-2 promotes endometrial tumor formation through activation of FAK and Src
Maoyong Fu et al. PLoS One. 2011.
Retraction in
- Retraction: Epithelial Membrane Protein-2 Promotes Endometrial Tumor Formation through Activation of FAK and Src.
PLOS ONE Editors. PLOS ONE Editors. PLoS One. 2022 Oct 11;17(10):e0276151. doi: 10.1371/journal.pone.0276151. eCollection 2022. PLoS One. 2022. PMID: 36219627 Free PMC article. No abstract available.
Abstract
Endometrial cancer is the most common gynecologic malignancy diagnosed among women in developed countries. One recent biomarker strongly associated with disease progression and survival is epithelial membrane protein-2 (EMP2), a tetraspan protein known to associate with and modify surface expression of certain integrin isoforms. In this study, we show using a xenograft model system that EMP2 expression is necessary for efficient endometrial tumor formation, and we have started to characterize the mechanism by which EMP2 contributes to this malignant phenotype. In endometrial cancer cells, the focal adhesion kinase (FAK)/Src pathway appears to regulate migration as measured through wound healing assays. Manipulation of EMP2 levels in endometrial cancer cells regulates the phosphorylation of FAK and Src, and promotes their distribution into lipid raft domains. Notably, cells with low levels of EMP2 fail to migrate and poorly form tumors in vivo. These findings reveal the pivotal role of EMP2 in endometrial cancer carcinogenesis, and suggest that the association of elevated EMP2 levels with endometrial cancer prognosis may be causally linked to its effect on integrin-mediated signaling.
Conflict of interest statement
Competing Interests: The authors have declared that no competing interests exist.
Figures
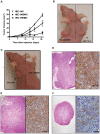
Figure 1. Tumor volume is increased in HEC-1A/EMP2 tumors.
(A) HEC-1A/EMP2, HEC-1A/V, and HEC-1A/RIBO cells were injected s.c. into nude mice. Tumor volume was determined using calipers. HEC-1A/EMP2 tumors were larger than tumors injected with HEC-1a/V and HEC-1a/RIBO cells. Values are averages (±SEM, n = 6). Comparison by ANOVA, p<0.05 (B) Representative nude Balb/c mouse displaying HEC-1A/EMP2 and HEC-1A/V subcutaneous tumors. (C) Representative Balb/c nude mouse displaying HEC-1A/V and HEC-1A/RIBO subcutaneous tumors. At day 30, HEC-1A/EMP2 (D), HEC-1A/V (E), and HEC-1A/RIBO (F) tumors were excised, fixed, and stained by hematoxylin and eosin or EMP2. H/E Magnification, 40X; EMP2 Staining Magnification, 400X. Scale bar = 10 µM.
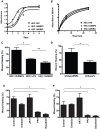
Figure 2. EMP2 expression and FAK/Src signaling promote wound healing.
(A) HEC-1A/EMP2, HEC-1A/V, and HEC-1A/RIBO cells were analyzed quantitatively for total cell numbers from 0–7 days or (B) BrdU incorporation after 2 or 24 hours. No significant differences in cellular proliferation or total cell numbers were observed between the three cell lines. The experiment was repeated at least 3 times with similar results. (C) HEC-1A/EMP2, HEC-1A/V, or HEC-1A/RIBO cells were grown in a monolayer and then a “wound” created. After 24 h, wound closure was measured. Experiments were performed at least three times, and the results averaged. Comparison by Student's t test, * p = 0.03; ** p = 0.05. (D) The same experiment was also performed on Ishikawa/EMP2 and Ishikawa/V. Comparison by Student's t test, * p = 0.02. (E) HEC-1A cells were grown to reach a confluent monolayer. Cells were incubated with the PP2, Dasatinib, Erlotinib, AKTi VIII, or a vehicle control, and a wound created. After 36 h, plates were imaged, and the percentage of wound closure was calculated. Values are averages (±SEM, n = 3). Comparison by Student's t test, * p<0.05. (F) The same experiment was also performed on Ishikawa cells. Values are averages (±SEM, n = 3). Comparison by Student's t test, * p<0.05.
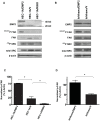
Figure 3. EMP2 promotes activated FAK and Src expression.
Expression of EMP2, 576/577 P-FAK, and 416 P-Src were assessed in (A) HEC-1A/EMP2, HEC-1A/V and HEC-1A/RIBO cells or (B) Ishikawa/EMP2 and Ishikawa/V cells. Semi-quantitative analysis of 576/577 P-FAK after correction for total FAK in both HEC-1A (C) and Ishikawa cells (D) from three independent experiments, respectively. β-actin expression was used as an additional loading control. Comparison by Student's t test, * p<0.05. EMP2 and β-actin panels of Figure 3A are excluded from this article's CC-BY license. See the accompanying retraction notice for more information.
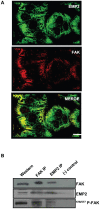
Figure 4. Total FAK and EMP2 associate with each other.
(A) Cellular images of HEC-1A cells. Cells were stained for EMP2 (FITC) and total FAK (Rhodamine) expression and imaged using confocal microscopy. EMP2 and FAK colocalize (yellow) in the cytoplasm and on the membrane of HEC-1A cells. Scale bar, 20 µM. (B) In order to assess if EMP2 and FAK immunoprecipitate together, HEC-1A cells were lysed in 1% NP-40 and an interaction assessed using immunoprecipitation/SDS-PAGE analysis. Both α-FAK antibodies and EMP2 antisera pulled down EMP2, FAK, and 576/577 p-FAK. Normal rabbit antisera served as the negative isotype control. Experiments were repeated three times with similar results; a representative image is displayed.
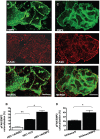
Figure 5. EMP2 and activated FAK colocalize.
(A) Cellular images of HEC-1A/EMP2 cells stained for confocal microscopy using EMP2 antisera (FITC) and FAK (activated at tyrosine 397; Rhodamine). (B) Data from at least four separate samples were quantitated using Pascal software to calculate pixel intensity, and the resultant data was evaluated by Student's unpaired _t_-test. Overexpression of EMP2 demonstrated a two-fold increase in colocalization with p-FAK compared to vector control cells. Less than 5% colocalization was observed in HEC-1A/RIBO cells. Student's t test, * p = 0.01; ** p = 0.0001. Scale bar, 25 µM. (C) Ishikawa/EMP2 cells were stained using EMP2 antisera (FITC) and FAK (activated at tyrosine 397; Rhodamine) and analyzed by confocal microscopy. (D) Data from at least four separate samples were quantitated and analyzed as above. Student's t test, * p = 0.01. Scale bar, 25 µM.
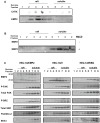
Figure 6. EMP2 forms a complex with FAK and Src in DIG lipid raft membrane domains.
(A) EMP2 expression in HEC-1A lipid raft membrane domains was verified by Brij-58 insolubility. Cells were lysed in 1% Brij-58 and centrifuged in a sucrose density gradient. Nine fractions (500 µl each) were collected from the top of the gradient and tested for GM1 by a cholera toxin-HRP dot blot and for EMP2 (∼_M_r 20 kDa) by using SDS-PAGE and Western blot analysis. (B) To verify the cholesterol dependence of EMP2 expression within the lipid raft. HEC-1A cells were preincubated in the presence (+) or absence (–) of MβCB. Cells were lysed in 1% Triton X-100, gradient fractionated, and EMP2 expression detected by Western blot analysis. (C) HEC-1A/EMP2, HEC-1A/V, and HEC-1A/RIBO cells were lysed in 1% Triton X-100 and centrifuged as above. Samples were probed by Western blot analysis for EMP2, activated FAK, activated Src, total FAK, total Src, Flotillin-2, and EEA1. Experiments were performed independently three times with similar results.
Similar articles
- Epithelial membrane protein-2 (EMP2) activates Src protein and is a novel therapeutic target for glioblastoma.
Qin Y, Fu M, Takahashi M, Iwanami A, Kuga D, Rao RG, Sudhakar D, Huang T, Kiyohara M, Torres K, Dillard C, Inagaki A, Kasahara N, Goodglick L, Braun J, Mischel PS, Gordon LK, Wadehra M. Qin Y, et al. J Biol Chem. 2014 May 16;289(20):13974-85. doi: 10.1074/jbc.M113.543728. Epub 2014 Mar 18. J Biol Chem. 2014. PMID: 24644285 Free PMC article. - FAK activation and the role of epithelial membrane protein 2 (EMP2) in collagen gel contraction.
Morales SA, Mareninov S, Wadehra M, Zhang L, Goodglick L, Braun J, Gordon LK. Morales SA, et al. Invest Ophthalmol Vis Sci. 2009 Jan;50(1):462-9. doi: 10.1167/iovs.07-1598. Epub 2008 May 9. Invest Ophthalmol Vis Sci. 2009. PMID: 18469192 Free PMC article. - Functional consequences of interactions between FAK and epithelial membrane protein 2 (EMP2).
Morales SA, Mareninov S, Coulam P, Wadehra M, Goodglick L, Braun J, Gordon LK. Morales SA, et al. Invest Ophthalmol Vis Sci. 2009 Oct;50(10):4949-56. doi: 10.1167/iovs.08-3315. Epub 2009 Jun 3. Invest Ophthalmol Vis Sci. 2009. PMID: 19494199 Free PMC article. - Integrin-regulated FAK-Src signaling in normal and cancer cells.
Mitra SK, Schlaepfer DD. Mitra SK, et al. Curr Opin Cell Biol. 2006 Oct;18(5):516-23. doi: 10.1016/j.ceb.2006.08.011. Epub 2006 Aug 17. Curr Opin Cell Biol. 2006. PMID: 16919435 Review. - Signal transduction by focal adhesion kinase in cancer.
Zhao J, Guan JL. Zhao J, et al. Cancer Metastasis Rev. 2009 Jun;28(1-2):35-49. doi: 10.1007/s10555-008-9165-4. Cancer Metastasis Rev. 2009. PMID: 19169797 Review.
Cited by
- The Multifaceted Role of Epithelial Membrane Protein 2 in Cancer: from Biomarker to Therapeutic Target.
Jang JY, Park MK, Lee CH, Lee H. Jang JY, et al. Biomol Ther (Seoul). 2024 Nov 1;32(6):697-707. doi: 10.4062/biomolther.2024.168. Epub 2024 Oct 21. Biomol Ther (Seoul). 2024. PMID: 39428387 Free PMC article. Review. - Expression of EMP 1, 2, and 3 in Adrenal Cortical Neoplasm and Pheochromocytoma.
Cha YJ, Koo JS. Cha YJ, et al. Int J Mol Sci. 2023 Aug 21;24(16):13016. doi: 10.3390/ijms241613016. Int J Mol Sci. 2023. PMID: 37629198 Free PMC article. - A-to-I RNA editing shows dramatic up-regulation in osteosarcoma and broadly regulates tumor-related genes by altering microRNA target regions.
Ge F, Cao X, Jiang Y. Ge F, et al. J Appl Genet. 2023 Sep;64(3):493-505. doi: 10.1007/s13353-023-00777-5. Epub 2023 Aug 5. J Appl Genet. 2023. PMID: 37542613 - The impact of early pregnancy metabolic disorders on pregnancy outcome and the specific mechanism.
Zhu XZ, Deng ZM, Dai FF, Liu H, Cheng YX. Zhu XZ, et al. Eur J Med Res. 2023 Jun 24;28(1):197. doi: 10.1186/s40001-023-01161-z. Eur J Med Res. 2023. PMID: 37355665 Free PMC article. Review. - Epithelial membrane protein 2 (EMP2) regulates hypoxia-induced angiogenesis in the adult retinal pigment epithelial cell lines.
Sun M, Cherian N, Liu L, Chan AM, Aguirre B, Chu A, Strawbridge J, Kim ES, Lin MC, Tsui I, Gordon LK, Wadehra M. Sun M, et al. Sci Rep. 2022 Nov 12;12(1):19432. doi: 10.1038/s41598-022-22696-x. Sci Rep. 2022. PMID: 36371458 Free PMC article.
References
- Creasman WT, Odicino F, Maisonneuve P, Beller U, Benedet JL, et al. Carcinoma of the corpus uteri. J Epidemiol Biostat. 2001;6:47–86. - PubMed
- Denschlag D, Tan L, Patel S, Kerim-Dikeni A, Souhami L, et al. Stage III endometrial cancer: preoperative predictability, prognostic factors, and treatment outcome. Am J Obstet Gynecol. 2007;196:546 e541–547. - PubMed
- Gossett DR, Alo P, Bristow RE, Galati M, Kyshtoobayeva A, et al. Inability of immunohistochemistry to predict clinical outcomes of endometrial cancer patients. IntJ GynecolCancer. 2004;14:145–151. - PubMed
- Wadehra M, Natarajan S, Seligson DB, Williams CJ, Hummer AJ, et al. Expression of epithelial membrane protein-2 is associated with endometrial adenocarcinoma of unfavorable outcome. Cancer. 2006;107:90–98. - PubMed
Publication types
MeSH terms
Substances
Grants and funding
- CA86366/CA/NCI NIH HHS/United States
- CA016042/CA/NCI NIH HHS/United States
- R21 CA131756/CA/NCI NIH HHS/United States
- P30 EY000331/EY/NEI NIH HHS/United States
- P30 CA016042/CA/NCI NIH HHS/United States
- P30 EY000331-45/EY/NEI NIH HHS/United States
- HD48540/HD/NICHD NIH HHS/United States
- U24 CA086366/CA/NCI NIH HHS/United States
- R03 HD048540/HD/NICHD NIH HHS/United States
LinkOut - more resources
Full Text Sources
Other Literature Sources
Molecular Biology Databases
Miscellaneous
