Human memory B cells originate from three distinct germinal center-dependent and -independent maturation pathways - PubMed (original) (raw)
. 2011 Aug 25;118(8):2150-8.
doi: 10.1182/blood-2011-04-345579. Epub 2011 Jun 20.
Gertjan J A Driessen, Vasilis Bikos, Christina Grosserichter-Wagener, Kostas Stamatopoulos, Andrea Cerutti, Bing He, Katharina Biermann, Johan F Lange, Mirjam van der Burg, Jacques J M van Dongen, Menno C van Zelm
Affiliations
- PMID: 21690558
- PMCID: PMC3342861
- DOI: 10.1182/blood-2011-04-345579
Human memory B cells originate from three distinct germinal center-dependent and -independent maturation pathways
Magdalena A Berkowska et al. Blood. 2011.
Abstract
Multiple distinct memory B-cell subsets have been identified in humans, but it remains unclear how their phenotypic diversity corresponds to the type of responses from which they originate. Especially, the contribution of germinal center-independent responses in humans remains controversial. We defined 6 memory B-cell subsets based on their antigen-experienced phenotype and differential expression of CD27 and IgH isotypes. Molecular characterization of their replication history, Ig somatic hypermutation, and class-switch profiles demonstrated their origin from 3 different pathways. CD27⁻IgG⁺ and CD27⁺IgM⁺ B cells are derived from primary germinal center reactions, and CD27⁺IgA⁺ and CD27⁺IgG⁺ B cells are from consecutive germinal center responses (pathway 1). In contrast, natural effector and CD27⁻IgA⁺ memory B cells have limited proliferation and are also present in CD40L-deficient patients, reflecting a germinal center-independent origin. Natural effector cells at least in part originate from systemic responses in the splenic marginal zone (pathway 2). CD27⁻IgA⁺ cells share low replication history and dominant Igλ and IgA2 use with gut lamina propria IgA+ B cells, suggesting their common origin from local germinal center-independent responses (pathway 3). Our findings shed light on human germinal center-dependent and -independent B-cell memory formation and provide new opportunities to study these processes in immunologic diseases.
Figures
Figure 1
Isolation and phenotypic characterization of peripheral blood memory B-cell subsets. (A) Gating strategy to identify 2 naive and 6 memory B-cell subsets based on expression of CD24, CD38, CD27, and IgH isotypes. (B) H&E staining of sorted subsets revealed a typical lymphocytic morphology with large nucleus (purple) and little cytoplasm (pink; ×63, original magnification; bars represent 5 μm). (C) All 6 memory B cell subsets showed up-regulation of CD80, CD180 and TACI as compared with naive B cells. Expression levels are shown in black and isotype controls as filled, gray histograms. Red lines indicate mode expression levels for each molecule on naive mature B cells.
Figure 2
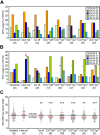
Selection against the IGHV4-34 gene and long IGH-CDR3s in all 6 memory B-cell subsets. (A) Frequencies of the most commonly used IGHV3 genes in cloned IGH gene rearrangements. Differences between each memory B-cell subset compared with naive mature B cells were statistically analyzed with the χ2 test. (B) Frequencies of the most commonly used IGHV4 genes in cloned IGH gene rearrangements. An arrow indicates IGHV4-34 gene use in naive mature B cells. Differences between each memory B-cell subset compared with naive mature B cells were statistically analyzed with the χ2 test. *P < .05, **P < .01. (C) IGH-CDR3 size distributions. All individual sizes are indicated for each subset as gray dots, with red lines representing the median values. The dashed and dotted lines represent median values for centroblasts (n = 67) and centrocytes (n = 55), respectively. Differences between each memory B-cell subset compared with naive mature B cells were statistically analyzed with the Mann-Whitney test. **P < .01, ***P < .001.
Figure 3
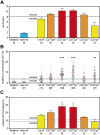
Discrimination of GC-dependent and -independent B-cell maturation pathways based on quantitative analysis of the replication history and SHM levels. (A) Replication history of 2 naive and 6 memory B-cell subsets as measured with the KREC assay. Three different levels of extensive proliferation in memory B-cell subsets in contrast to naive B cells (blue) could be identified: lower than GC (yellow bars), similar to GC (orange bars) and increased compared with GC (red bars). Bars represent mean values with SEM. In the whole figure, dashed and dotted lines represent values for centroblasts and centrocytes, respectively. Differences between each memory B-cell subset compared with centrocytes were statistically analyzed with the Mann-Whitney test. (B) Frequency of mutated nucleotides in rearranged IGHV genes. All individual data points are shown as gray dots, with red lines indicating the median value. Differences between each memory B-cell subset compared with centrocytes were statistically analyzed with the Mann-Whitney test. **P < .01, ***P < .001. (C) Frequency of mutated IGKV3-20 genes as measured with the IgκREHMA assay. Bars represent mean values with SEM. Differences between each memory B-cell subset compared with centrocytes were statistically analyzed with the Mann-Whitney test. *P < .05.
Figure 4
Molecular analysis of Ig class switching in IgA+ and IgG+ memory B-cell subsets. (A) Schematic representation of the constant region of the human IGH locus. (B) Distribution of IgA and IgG receptor subclass use in IGH rearrangements of class-switched memory B-cell subsets. Total number of analyzed sequences is indicated in the center of each plot. Differences in the distribution were statistically analyzed with the χ2 test and were found significant for both CD27+IgG+ vs CD27−IgG+ (P < .0001) and CD27+IgA+ vs CD27−IgA+ (P < .05) B-cell subsets. (C) Frequency of Sμ-Sα and Sμ-Sγ rearrangements bearing remnants of indirect class switching. Number of analyzed sequences is given in brackets. (D) Examples of direct and sequential class switching; a piece of Sγ3 sequence in the Sμ-Sγ2 junction is indicated boxed in red font.
Figure 5
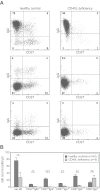
GC-independent generation of natural effector and CD27−IgA+ memory B cells. (A) Memory B-cell subset distribution was analyzed in 5 CD40L-deficient patients (age, 1-13 years) and 50 healthy controls (age, 1-5 years). Representative FACS plots of B-cell subsets. (B) Absolute cell numbers of 6 memory B-cell subsets. Bars represent mean values with SEM. Statistical significance was calculated with the Mann-Whitney test. * P < .05, **P < .01, ***P < .001.
Figure 6
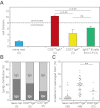
CD27−IgA+ memory B cells resemble colon lamina propria IgA+ B cells. (A) Replication history in naive mature, IgA+ memory B-cell subsets and CD19+IgA2+ B cells isolated from human colon lamina propria as measured with the KREC assay. Bars represent mean values with SEM. Statistical significance was calculated with the Mann-Whitney test. (B) Igκ and Igλ isotype distribution of naive mature and IgA+ memory B cell subsets as determined with flow cytometric analysis. (C) Frequency of mutated nucleotides in rearranged IGLV gene segments. All individual data points are showed as gray dots, with red lines indicating the median value. Statistical significance was calculated with the Mann-Whitney test. **P < .01.
Figure 7
Model of human memory B-cell generation from GC-dependent and -independent pathways. Six purified memory B-cell subsets showed differential levels of proliferation and BCR maturation. Ig class-switching profiles and immunophenotyping of blood of CD40L-deficient patients supported delineation of these 6 subsets from T cell-dependent and -independent maturation pathways. CD27−IgA+ and natural effector B cells can be derived independently from T-cell help, probably locally in the gastrointestinal tract and from systemic responses in splenic marginal zone, respectively. The molecular profiles of CD27−IgG+ and CD27+IgM+ memory B cells resembled those of primary GC cells, whereas CD27+IgG+ and CD27+IgA+ memory B cells has increased proliferation and SHM levels suggestive of further maturation in consecutive GC response.
Similar articles
- Memory B cells without somatic hypermutation are generated from Bcl6-deficient B cells.
Toyama H, Okada S, Hatano M, Takahashi Y, Takeda N, Ichii H, Takemori T, Kuroda Y, Tokuhisa T. Toyama H, et al. Immunity. 2002 Sep;17(3):329-39. doi: 10.1016/s1074-7613(02)00387-4. Immunity. 2002. PMID: 12354385 - The different process of class switching and somatic hypermutation; a novel analysis by CD27(-) naive B cells.
Nagumo H, Agematsu K, Kobayashi N, Shinozaki K, Hokibara S, Nagase H, Takamoto M, Yasui K, Sugane K, Komiyama A. Nagumo H, et al. Blood. 2002 Jan 15;99(2):567-75. doi: 10.1182/blood.v99.2.567. Blood. 2002. PMID: 11781240 - Naive and memory B cells in T-cell-dependent and T-independent responses.
Zubler RH. Zubler RH. Springer Semin Immunopathol. 2001 Dec;23(4):405-19. doi: 10.1007/s281-001-8167-7. Springer Semin Immunopathol. 2001. PMID: 11826617 Review. - CD27 on human memory B cells-more than just a surface marker.
Grimsholm O. Grimsholm O. Clin Exp Immunol. 2023 Jul 21;213(2):164-172. doi: 10.1093/cei/uxac114. Clin Exp Immunol. 2023. PMID: 36508329 Free PMC article. Review.
Cited by
- Transitional B cell subsets in human bone marrow.
Agrawal S, Smith SA, Tangye SG, Sewell WA. Agrawal S, et al. Clin Exp Immunol. 2013 Oct;174(1):53-9. doi: 10.1111/cei.12149. Clin Exp Immunol. 2013. PMID: 23731328 Free PMC article. - Homologous but not heterologous COVID-19 vaccine booster elicits IgG4+ B-cells and enhanced Omicron subvariant binding.
Hartley GE, Fryer HA, Gill PA, Boo I, Bornheimer SJ, Hogarth PM, Drummer HE, O'Hehir RE, Edwards ESJ, van Zelm MC. Hartley GE, et al. NPJ Vaccines. 2024 Jul 17;9(1):129. doi: 10.1038/s41541-024-00919-8. NPJ Vaccines. 2024. PMID: 39013889 Free PMC article. - Stereotyped B-cell receptors in one-third of chronic lymphocytic leukemia: a molecular classification with implications for targeted therapies.
Agathangelidis A, Darzentas N, Hadzidimitriou A, Brochet X, Murray F, Yan XJ, Davis Z, van Gastel-Mol EJ, Tresoldi C, Chu CC, Cahill N, Giudicelli V, Tichy B, Pedersen LB, Foroni L, Bonello L, Janus A, Smedby K, Anagnostopoulos A, Merle-Beral H, Laoutaris N, Juliusson G, di Celle PF, Pospisilova S, Jurlander J, Geisler C, Tsaftaris A, Lefranc MP, Langerak AW, Oscier DG, Chiorazzi N, Belessi C, Davi F, Rosenquist R, Ghia P, Stamatopoulos K. Agathangelidis A, et al. Blood. 2012 May 10;119(19):4467-75. doi: 10.1182/blood-2011-11-393694. Epub 2012 Mar 13. Blood. 2012. PMID: 22415752 Free PMC article. - The peripheral blood compartment in patients with Graves' disease: activated T lymphocytes and increased transitional and pre-naive mature B lymphocytes.
Van der Weerd K, Van Hagen PM, Schrijver B, Kwekkeboom DJ, De Herder WW, Ten Broek MR, Postema PT, Van Dongen JJ, Staal FJ, Dik WA. Van der Weerd K, et al. Clin Exp Immunol. 2013 Nov;174(2):256-64. doi: 10.1111/cei.12183. Clin Exp Immunol. 2013. PMID: 23901889 Free PMC article. - Evaluation of the Antigen-Experienced B-Cell Receptor Repertoire in Healthy Children and Adults.
IJspeert H, van Schouwenburg PA, van Zessen D, Pico-Knijnenburg I, Driessen GJ, Stubbs AP, van der Burg M. IJspeert H, et al. Front Immunol. 2016 Oct 17;7:410. doi: 10.3389/fimmu.2016.00410. eCollection 2016. Front Immunol. 2016. PMID: 27799928 Free PMC article.
References
- Ghia P, ten Boekel E, Rolink AG, Melchers F. B-cell development: a comparison between mouse and man. Immunol Today. 1998;19(10):480–485. - PubMed
- Odegard VH, Schatz DG. Targeting of somatic hypermutation. Nat Rev Immunol. 2006;6(8):573–583. - PubMed
- Chaudhuri J, Alt FW. Class-switch recombination: interplay of transcription, DNA deamination and DNA repair. Nat Rev Immunol. 2004;4(7):541–552. - PubMed
Publication types
MeSH terms
Substances
Grants and funding
- R01 AI074378-04/AI/NIAID NIH HHS/United States
- R01 AI074378-05/AI/NIAID NIH HHS/United States
- U01 AI095613/AI/NIAID NIH HHS/United States
- U19 AI096187/AI/NIAID NIH HHS/United States
- R01 AI074378/AI/NIAID NIH HHS/United States
- P01 AI061093/AI/NIAID NIH HHS/United States
- R01 AI074378-06/AI/NIAID NIH HHS/United States
LinkOut - more resources
Full Text Sources
Other Literature Sources
Research Materials
Miscellaneous


