Breast cancer cells produce tenascin C as a metastatic niche component to colonize the lungs - PubMed (original) (raw)
Breast cancer cells produce tenascin C as a metastatic niche component to colonize the lungs
Thordur Oskarsson et al. Nat Med. 2011.
Abstract
We report that breast cancer cells that infiltrate the lungs support their own metastasis-initiating ability by expressing tenascin C (TNC). We find that the expression of TNC, an extracellular matrix protein of stem cell niches, is associated with the aggressiveness of pulmonary metastasis. Cancer cell-derived TNC promotes the survival and outgrowth of pulmonary micrometastases. TNC enhances the expression of stem cell signaling components, musashi homolog 1 (MSI1) and leucine-rich repeat-containing G protein-coupled receptor 5 (LGR5). MSI1 is a positive regulator of NOTCH signaling, whereas LGR5 is a target gene of the WNT pathway. TNC modulation of stem cell signaling occurs without affecting the expression of transcriptional enforcers of the stem cell phenotype and pluripotency, namely nanog homeobox (NANOG), POU class 5 homeobox 1 (POU5F1), also known as OCT4, and SRY-box 2 (SOX2). TNC protects MSI1-dependent NOTCH signaling from inhibition by signal transducer and activator of transcription 5 (STAT5), and selectively enhances the expression of LGR5 as a WNT target gene. Cancer cell-derived TNC remains essential for metastasis outgrowth until the tumor stroma takes over as a source of TNC. These findings link TNC to pathways that support the fitness of metastasis-initiating breast cancer cells and highlight the relevance of TNC as an extracellular matrix component of the metastatic niche.
Figures
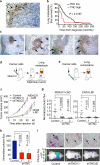
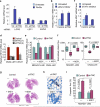
Figure 1. TNC expression in lung metastatic foci and association with lung relapse
(a) Heterogeneous TNC expression in human lung metastasis. TNC immunostaining (arrows) on lung metastasis section from an individual with breast cancer. Scale bar, 50 μm. (b) Kaplan-Meier analysis of lung metastasis–free survival in subjects with breast cancer, on the basis of TNC expression in dissected lung metastases. TNC immunostaining of tissue sections was used to classify metastases into two groups, TNC low (n = 51) or TNC high (n = 15). P value was determined by log-rank test. (c) Immunohistochemical analysis of TNC expression in lung metastatic foci of various sizes formed by MDA231-LM2 cells in mice. TNC accumulation at the invasive front in larger metastatic foci. Arrows, TNC expression. Scale bar, 50 μm. (d) Schematic of orthotopic metastasis assay in mice. MDA231-LM2 or CN34-LM1 cells were injected bilaterally into the fourth mammary fat pads leading to spontaneous lung metastasis. (e) Schematic of lung colonization assay by intravenous injection of cancer cells. (f) Growth curves of mammary tumors arising from MDA231-LM2 or CN34-LM1 cells and their TNC knockdown counterparts. Mammary tumor growth was measured with a digital caliper. Values are means ± s.e.m. (g) Lung metastasis in mammary tumor–bearing mice determined at week 6 by ex vivo luciferase luminescence. MDA231-LM2 control, n = 15; shTNC(1), n = 15; shTNC(2), n = 14. CN34-LM1 control, n = 10; shTNC(1), n = 8; shTNC(2), n = 10. P values were obtained by two-tailed Student's t test. (h) Lung colonization, as determined by bioluminescence, in mice injected intravenously with control and shTNC-transduced CN34LM1 cells . Values are mean ± s.e.m. P values were determined by Student's t test. (i) Representative luminescence images and H&E-stained lung sections from each group. Arrows, metastatic lesions. Scale bar, 100 μm.
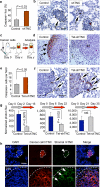
Figure 2. Cancer cell–derived TNC mediates resistance to apoptosis in micrometastasis
(a,b) Apoptosis in early metastatic foci analyzed by immunohistochemistry. Average number (a) and representative images (b) of MDA231-LM2 apoptotic foci containing cleaved caspase 3+ cells at day 10 of lung colonization. n = 3 mice per condition; values are mean ± s.e.m. Arrows, apoptotic cells. M, metastatic foci. L, lung parenchyma. Scale bar, 20 μm. (c) Schematic of conditional TNC knockdown experiment. Lung colonization of MDA231-LM2 cells containing doxycycline (Dox)-inducible TNC shRNA (Tet-shTNC) was allowed for different lengths of time (day x) before TNC knockdown was induced by administration of doxycycline to the mice. Lung colonies were then analyzed (day y). (d) TNC staining in lung metastatic foci in control or Tet-shTNC MDA231-LM2. Cells were injected intravenously and allowed to colonize the lungs for 25 d. Thereafter, TNC knockdown was induced with doxycycline for 10 d, and lung sections were analyzed by TNC immunohistochemistry (arrows). Scale bar, 20 μm. (e) Analysis of apoptosis in established lung foci. Cleaved caspase 3 was quantified in control and Tet-shTNC (day 25 of lung colonization) mice after doxycycline administration for an additional 10 d. n = 3 mice per condition; values are mean ± s.e.m. (f) Representative examples of apoptotic cells at the invasive edge of established metastatic foci. Arrows, cleaved caspase 3+ cells. Scale bar, 20 μm. (g) Bioluminescence analysis of MDA231-LM2–mediated lung colonization in which TNC was conditionally knocked down at different time points. Left, TNC knocked down by 2-week-long doxycycline treatment starting 2 d after tail vein injection. Middle, doxycycline treatment at day 6. Right, doxycycline induction at day 21, maintained for 2 weeks. Two-tailed Student's t test was used to determine all P values. (h) Immunofluorescence analysis of TNC expression in MDA231-LM2 metastatic foci at different time points during lung colonization. Time points analyzed were days 10 and 36 (D10 and D36, respectively) after intravenous inoculation. Antibodies to stromal derived mouse TNC (mTNC) and tumor cell–derived human TNC (hTNC) were used. DAPI was used for nuclear staining. Scale bar, 20 μm.
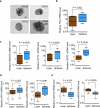
Figure 3. Expression of TNC and stem cell markers in oncospheres
(a) Examples of tumor spheres from various pleural effusion samples from subjects with breast cancer, grown in serum-free medium on nonadhesive plates (scale bar, 20 μm). (b–e) Gene expression analysis of oncospheres derived from pleural effusion samples compared to monolayer cultures of the same samples. Gene expression was analyzed by quantitative RT-PCR (qRT-PCR). TNC expression (b) was upregulated in oncospheres together with the expression of embryonic stem cell markers NANOG, OCT4 and SOX2 (c) and adult stem cell markers MSI1 and LGR5 (d). In contrast, the mammary differentiation marker GATA3 and the TNC- and metastasis-suppressor miRNA miR-335 were downregulated in oncospheres (e). n = 9–10 pleural fluid–derived cell samples. All P values were calculated by paired Wilcoxon signed rank test (two tailed). Whiskers represent minimum and maximum values.
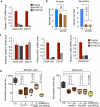
Figure 4. Regulation of oncosphere growth MSI1 and LGR5 by TNC
(a) TNC expression in oncospheres derived from CN34-LM1 cells and CN127 breast cancer cells expressing two independent TNC shRNAs. (b) Quantitative analysis of oncosphere formation in TNC-deficient CN34-LM1 cells. (c) Gene expression analysis in TNC-deficient oncospheres. Expression was analyzed by qRT-PCR; values are mean ± s.d. of triplicate experiments. For all genes, the expression in knockdown lines was normalized to control. (d) Lung colonization of MDA231-LM2 and CN34-LM1 cells transduced with short hairpins against MSI1 and LGR5 individually and in combination. Ctr, control. Student's t test was used to determine P values. n = 5 mice per condition. Whiskers represent minimum and maximum values.
Figure 5. TNC enhances WNT and NOTCH signaling in breast cancer cells
(a) WNT3A induced LGR5, LEF1 and AXIN2 expression in CN34-LM1 oncospheres. Ctr, control. (b,c) MSI1 expression induced in TNC knockdown CN34-LM1 oncospheres by treatment with JAK2 inhibitor AG490 (b) or STAT5 inhibitor nicotinoyl hydrazone (c). (d) Expression of NOTCH target gene HEY2 in TNC knockdown oncospheres. (e) HEY2 expression in control or TNC knockdown CN34-LM1 and MDA231-LM2 cells transduced with MSI1 expression vector. (f) Lung luminescence in mice intravenously injected with CN34-LM1 or MDA231-LM2 cells. Control and shTNC knockdown cells were transduced with vector expressing MSI1 or control vector. Normalized photon flux was measured 1 week after tail vein injection. n = 5 mice per condition. P values were obtained using a two-tailed Student's t test. Whiskers represent minimum and maximum values. (g) Representative images of H&E-stained lung sections from experiment in f at 6 weeks. (h) Immunohistochemical analysis of cleaved caspase 3 in metastatic foci 10 d after tail vein injection. Representative images from MDA231-LM2 shTNC cells with or without ectopic MSI1 expression. Scale bar, 20 μm. (i) Number of cleaved caspase 3+ foci formed by MDA231-LM2 cells at day 10 of lung colonization. Control and shTNC cells were analyzed with or without overexpression of MSI1. n = 4 mice per condition. P values were obtained by two-tailed Student's t test. Error bars represent standard deviation.
Figure 6. TNC association with STAT5 and Musashi in breast cancer metastasis
(a) Proportion of TNCS+ cases in primary breast tumors and metastatic nodules from different organ sites. Primary breast tumors (n = 344), lung metastases (n = 18), bone metastasis (n = 16), brain metastasis (n = 19) and other metastasis (5 liver, 7 ovary, 1 chest wall and 1 duodenum). *P = 0.0033, **P = 0.01, ***P = 0.008, calculated by Fisher's exact tests. (b) Kaplan-Meier analysis of bone metastatic free survival (left) and brain metastatic survival (right) in a xenograft mouse model. MDA231-BoM1 and MDA231-BrM2 transduced with shTNC were injected intracardially and metastasis was determined by bioluminescence. Bone metastasis experiment: control, n = 9; shTNC, n = 15 (pooled samples from two TNC hairpins). Brain metastasis experiment: control, n = 9; shTNC, n = 17 (pooled samples from two TNC hairpins). P values were determined by log-rank test. (c) Relative levels of MSI1 in TNCS+ and TNCS− human metastasis samples. P value was calculated by two tailed Student's t test. (d) GSEA. Analysis of genes either up- or downregulated in the STAT5 signature (STAT5S) and their enrichment within TNCS+ metastases. P values were determined by a random permutation test. (e) Relative expression of MSI1 within STAT5+ or STAT5− human breast cancer metastases. (f) Summary model of the role of TNC in the outgrowth of micrometastasis. Metastasis-initiating breast cancer cells with low expression of the metastasis suppressor miR-335 highly express TNC, supporting the survival and outgrowth of these cells in the pulmonary parenchyma. TNC interaction with cancer cells at the invasive front enhances signaling by the NOTCH and WNT pathways, promoting the viability of these cells and the reinitiation of metastatic outgrowth.
Similar articles
- Activation of NOTCH Signaling by Tenascin-C Promotes Growth of Human Brain Tumor-Initiating Cells.
Sarkar S, Mirzaei R, Zemp FJ, Wei W, Senger DL, Robbins SM, Yong VW. Sarkar S, et al. Cancer Res. 2017 Jun 15;77(12):3231-3243. doi: 10.1158/0008-5472.CAN-16-2171. Epub 2017 Apr 17. Cancer Res. 2017. PMID: 28416488 - Tenascin-C modulates tumor stroma and monocyte/macrophage recruitment but not tumor growth or metastasis in a mouse strain with spontaneous mammary cancer.
Talts JF, Wirl G, Dictor M, Muller WJ, Fässler R. Talts JF, et al. J Cell Sci. 1999 Jun;112 ( Pt 12):1855-64. doi: 10.1242/jcs.112.12.1855. J Cell Sci. 1999. PMID: 10341205 - Tenascin C in metastasis: A view from the invasive front.
Lowy CM, Oskarsson T. Lowy CM, et al. Cell Adh Migr. 2015;9(1-2):112-24. doi: 10.1080/19336918.2015.1008331. Cell Adh Migr. 2015. PMID: 25738825 Free PMC article. Review. - Tenascin-C Induces Phenotypic Changes in Fibroblasts to Myofibroblasts with High Contractility through the Integrin αvβ1/Transforming Growth Factor β/SMAD Signaling Axis in Human Breast Cancer.
Katoh D, Kozuka Y, Noro A, Ogawa T, Imanaka-Yoshida K, Yoshida T. Katoh D, et al. Am J Pathol. 2020 Oct;190(10):2123-2135. doi: 10.1016/j.ajpath.2020.06.008. Epub 2020 Jul 8. Am J Pathol. 2020. PMID: 32650003 - Transcriptional regulation of tenascin genes.
Chiovaro F, Chiquet-Ehrismann R, Chiquet M. Chiovaro F, et al. Cell Adh Migr. 2015;9(1-2):34-47. doi: 10.1080/19336918.2015.1008333. Cell Adh Migr. 2015. PMID: 25793574 Free PMC article. Review.
Cited by
- A cell-ECM screening method to predict breast cancer metastasis.
Barney LE, Dandley EC, Jansen LE, Reich NG, Mercurio AM, Peyton SR. Barney LE, et al. Integr Biol (Camb). 2015 Feb;7(2):198-212. doi: 10.1039/c4ib00218k. Integr Biol (Camb). 2015. PMID: 25537447 Free PMC article. - Inflammation Triggers Zeb1-Dependent Escape from Tumor Latency.
De Cock JM, Shibue T, Dongre A, Keckesova Z, Reinhardt F, Weinberg RA. De Cock JM, et al. Cancer Res. 2016 Dec 1;76(23):6778-6784. doi: 10.1158/0008-5472.CAN-16-0608. Epub 2016 Aug 16. Cancer Res. 2016. PMID: 27530323 Free PMC article. - Quantification of the N-glycosylated secretome by super-SILAC during breast cancer progression and in human blood samples.
Boersema PJ, Geiger T, Wisniewski JR, Mann M. Boersema PJ, et al. Mol Cell Proteomics. 2013 Jan;12(1):158-71. doi: 10.1074/mcp.M112.023614. Epub 2012 Oct 22. Mol Cell Proteomics. 2013. PMID: 23090970 Free PMC article. - Breastmilk is a novel source of stem cells with multilineage differentiation potential.
Hassiotou F, Beltran A, Chetwynd E, Stuebe AM, Twigger AJ, Metzger P, Trengove N, Lai CT, Filgueira L, Blancafort P, Hartmann PE. Hassiotou F, et al. Stem Cells. 2012 Oct;30(10):2164-74. doi: 10.1002/stem.1188. Stem Cells. 2012. PMID: 22865647 Free PMC article. - Tenascin-C immobilizes infiltrating T lymphocytes through CXCL12 promoting breast cancer progression.
Murdamoothoo D, Sun Z, Yilmaz A, Riegel G, Abou-Faycal C, Deligne C, Velazquez-Quesada I, Erne W, Nascimento M, Mörgelin M, Cremel G, Paul N, Carapito R, Veber R, Dumortier H, Yuan J, Midwood KS, Loustau T, Orend G. Murdamoothoo D, et al. EMBO Mol Med. 2021 Jun 7;13(6):e13270. doi: 10.15252/emmm.202013270. Epub 2021 May 14. EMBO Mol Med. 2021. PMID: 33988305 Free PMC article.
References
- Hüsemann Y, et al. Systemic spread is an early step in breast cancer. Cancer Cell. 2008;13:58–68. - PubMed
- Cameron MD, et al. Temporal progression of metastasis in lung: cell survival, dormancy, and location dependence of metastatic inefficiency. Cancer Res. 2000;60:2541–2546. - PubMed
Publication types
MeSH terms
Substances
LinkOut - more resources
Full Text Sources
Other Literature Sources
Medical
Research Materials
Miscellaneous
