Spatial exclusivity combined with positive and negative selection of phosphorylation motifs is the basis for context-dependent mitotic signaling - PubMed (original) (raw)
. 2011 Jun 28;4(179):ra42.
doi: 10.1126/scisignal.2001796.
Daniel Lim, Brian A Joughin, Björn Hegemann, James R A Hutchins, Tobias Ehrenberger, Frank Ivins, Fabio Sessa, Otto Hudecz, Erich A Nigg, Andrew M Fry, Andrea Musacchio, P Todd Stukenberg, Karl Mechtler, Jan-Michael Peters, Stephen J Smerdon, Michael B Yaffe
Affiliations
- PMID: 21712545
- PMCID: PMC3939359
- DOI: 10.1126/scisignal.2001796
Spatial exclusivity combined with positive and negative selection of phosphorylation motifs is the basis for context-dependent mitotic signaling
Jes Alexander et al. Sci Signal. 2011.
Abstract
The timing and localization of events during mitosis are controlled by the regulated phosphorylation of proteins by the mitotic kinases, which include Aurora A, Aurora B, Nek2 (never in mitosis kinase 2), Plk1 (Polo-like kinase 1), and the cyclin-dependent kinase complex Cdk1/cyclin B. Although mitotic kinases can have overlapping subcellular localizations, each kinase appears to phosphorylate its substrates on distinct sites. To gain insight into the relative importance of local sequence context in kinase selectivity, identify previously unknown substrates of these five mitotic kinases, and explore potential mechanisms for substrate discrimination, we determined the optimal substrate motifs of these major mitotic kinases by positional scanning oriented peptide library screening (PS-OPLS). We verified individual motifs with in vitro peptide kinetic studies and used structural modeling to rationalize the kinase-specific selection of key motif-determining residues at the molecular level. Cross comparisons among the phosphorylation site selectivity motifs of these kinases revealed an evolutionarily conserved mutual exclusion mechanism in which the positively and negatively selected portions of the phosphorylation motifs of mitotic kinases, together with their subcellular localizations, result in proper substrate targeting in a coordinated manner during mitosis.
Figures
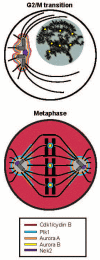
Fig. 1. Major mitotic kinases have both discrete and overlapping subcellular localizations in mitotic cells
Schematic representation showing the localizations of Cdk1/Cyclin B, Aurora A, Aurora B, Plk1, and Nek2 are indicated at the G2/M transition or early prophase (top) and in metaphase (bottom). In the top panel, a magnified representation of the centrosome with nucleated microtubules is shown, illustrating Nek2 localization near the proximal centrioles in the centrosomal core. The nucleus is shaded grey, containing duplicated but uncondensed chromosomes (black). In the bottom panel, condensed chromosomes are shown aligned on the metaphase plate, with their kinetochores indicated by central co-axial circles, attached to spindle microtubules.
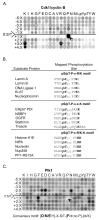
Fig. 2. Phosphorylation motifs for Cdk1/cyclin B and Plk1
(A) The substrate motif for Cdk1/cyclin B reveals near exclusive selection for Pro in the Ser/Thr+1 position, strong selectivity for Arg and Lys in the Ser/Thr+3 position, and Lys in the Ser/Thr+4 position. (B) Comparison of the expanded Cdk1/cyclin B motif with mapped substrate sites (49). Bold represents residues that distinguish the submotifs. (C) The substrate motif for Plk1 reveals selection for Asp, Asn, or Glu in the Ser/Thr-2 position and hydrophobic amino acids (Φ) in the Ser/Thr+1 position, and discrimination against Pro in the Ser/Thr+1 position.
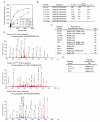
Fig. 3. Kinetics of Plk1 phosphorylation and identification of an expanded consensus motif
(A) Kinetics of peptide phosphorylation by the Plk1 T210D kinase domain using an optimal substrate peptide and peptides with single amino acid substitutions at the indicated positions. Peptide sequences are shown in panel B. (B) Kinetic parameters (Km, Vmax, and Vmax/Km ratio) for the phosphorylation of the indicated peptides by Plk1 were determined by fitting the data to the Michaelis-Menten equation. Bold residues in the sequences represent the ones substituted. (C) The substrate specificity motif of Plk1 matches previously mapped Plk1 phosphorylation sites, which contain Asp or Glu in the Ser/Thr-2 and hydrophobic amino acids in the Ser/Thr+1 position. Bold represents motif-distinguishing residues. (D) Annotated MS/MS spectra for the phosphopeptides containing three Plk1 inhibitor-sensitive phosphosites containing Asn in the Ser/Thr-2 position. S# in the phosphopeptide sequence represents phosphoserine. (E) Sequence motifs of the sites mapped from the data shown in panel D.
Fig. 4. Phosphorylation motif selectivity of Aurora A and B
(A) PS-OPLS blots of Aurora A (left) and Aurora B:INCENP complex (right) reveal positively and negatively selected residues for motifs recognized by these kinases. The arrowheads identify the complete selectivity against Pro at position Ser/Thr+1. (B) Peptide phosphorylation and determination of kinetic parameters (Km, Vmax, and Vmax/Km ratio) for reactions of Aurora B:INCENP with the optimal substrate peptide and peptides with single amino acid substitutions. A graph of reaction data fitted to the Michaelis-Menten equation for peptides is indicated on the left, and a table of kinetic parameters is shown on the right. R-2D tide and M+1P tide sequences are indicated below the table with the substituted positions shown in bold. (C) Previously published phosphorylation sites on mapped substrates of Aurora A (left) and Aurora B (right) conform to the optimal phosphorylation motif determined by PS-OPLS. Bold represents motif selected residues.
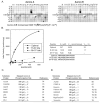
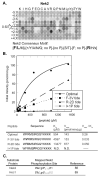
Fig. 5. Phosphorylation motif selectivity for Nek2
(A) PS-OPLS screening reveals that Nek2 strongly selects a subset of hydrophobic amino acids in the Ser/Thr-3 and the Ser/Thr+1 positions and Arg in the Ser/Thr+2 position, but strongly discriminates against Pro in the Ser/Thr+1 position. Additional selection against acidic residues in the Ser/Thr-3, Ser/Thr+1 and +2 positions is also observed, as is positive selection for certain residues in the Ser/Thr-2 position. Within the indicated motif, + denotes basic residues, Φ denotes hydrophobic residues, and Ψ denotes aromatic residues. (B) Peptide phosphorylation and determination of kinetic parameters (Km, Vmax, and Vmax/Km ratio) for reactions of Nek2 with the optimal substrate peptide and peptides with single amino acid substitutions. A graph of reaction data fitted to the Michaelis-Menten equation for peptides is indicated on the top, and a table of kinetic parameters is shown on the bottom. F-3V tide, R-2D tide, and I+1P tide, sequences are indicated in the table with the substituted positions relative to the optimal peptide shown in bold. (C) Previously published mapped Nek2 phosphorylation sites are in reasonable agreement with the Nek2 PS-OPLS phosphorylation motif. Bold represents motif selected residues.
Fig. 6. Exclusivity of phosphorylation motifs for major mitotic kinases
(A) PS-OPLS blots for Plk1, Aurora A, Aurora B, and Nek2 are pseudocolored and superimposed. Note the near identity of the Aurora A and B motifs in the merged view, and the distinct lack of superposition of the Aurora A/B and Plk1 motifs, as revealed by the largely distinct green and purple spots. The Nek2 motif shows substantial overlap with that of Plk1 and Aurora at multiple positions. (B) Spot intensities from the PS-OPLS blots were quantified and used to generate motif logos for each of the major mitotic kinases. Basic residues are colored blue, acidic residues red, amide side chain-containing residues cyan, Pro green, and the remaining residues in black. AurA, Aurora A; AurB, Aurora B.
Fig. 7. Structural basis for kinase motif selectivity and exclusivity
(A) Optimal peptides for Plk1 (Plk1tide), Nek2 (Nek2tide), and Aurora B (AurBtide) were used as substrates in phosphorylation reactions containing the indicated kinases. The amount of radioactivity incorporated into each peptide after a one-hour incubation is indicated, showing mean values and standard deviations from triplicate measurements. (B) Modeled structures of kinases bound to optimal substrates (Cdk1/cyclin B:HHASPRK; Plk1:HDTSFYWA; Aurora B:RRHSMGW; Nek2:FRASIR). The molecular surfaces corresponding to the active site regions for each kinase are shown with red and blue regions indicating negative and positive electrostatic potentials, respectively. Active site features important for substrate selectivity are circled with yellow dotted lines and numbered relative to the position of the phospho-acceptor. Peptide substrates are shown with cartoon rendering for the backbone and stick rendering for relevant side chains. The phosphoacceptor Ser residues are indicated with yellow asterisks. For Cdk1, the +1 region corresponds to Val164 of Cdk1, the +3 region corresponds to pThr160 of Cdk1, and the +4 region corresponds to Glu265 and Asp268 of cyclin B. For Plk1, the −2 regions correspond to Lys178 and Asn216, and the +1 region corresponds to Leu211, Pro215, Ile218 and Val222. For Aurora B, the −3 region corresponds to Glu177, the −2 regions correspond to Glu220 and Glu281, and the +1 region corresponds to Trp237, Met249 and Leu256. For Nek2, the −3 region corresponds to Ala95 and Ala145, the −2 region corresponds to Glu208, and the +1 region corresponds to Phe176, Pro180 and Met183.
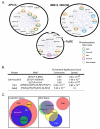
Fig. 8. Orthogonal mitotic kinase motif and localization ‘spaces’ provide substrate site specificity
(A) A selection of mitotic protein complexes identified by Hutchins et al. (122) are shown within black circles and annotated based on the literature for the presence of mapped mitotic phosphorylation sites by the indicated kinases. Note that multiple mitotic kinases phosphorylate discrete sites within single complexes. Blue lines indicate direct intra-cluster interactions. (B) Subproteomes associated with the spindle and centrosome were scored for the occurrence of the Cdk1, Nek2 and Plk1 motifs and compared to the expected number of sites at those locations based on the entire proteome. The enrichment significance score indicates the statistical significance of overenrichment based on a hypergeometric probability distribution. (C) Mitotic kinase functionality is represented by Venn diagrams of ‘localization space’ and ‘motif space’. In ‘localization space’, each circle represents the total subcellular locales available to that kinase. In ‘motif space’, each circle represents the sequences that can be phosphorylated by the kinase. In this representation, a major mitotic kinase can overlap with every other kinase in at most one of these two spaces.
Similar articles
- Quantitative phosphoproteomics identifies substrates and functional modules of Aurora and Polo-like kinase activities in mitotic cells.
Kettenbach AN, Schweppe DK, Faherty BK, Pechenick D, Pletnev AA, Gerber SA. Kettenbach AN, et al. Sci Signal. 2011 Jun 28;4(179):rs5. doi: 10.1126/scisignal.2001497. Sci Signal. 2011. PMID: 21712546 Free PMC article. - Bora phosphorylation substitutes in trans for T-loop phosphorylation in Aurora A to promote mitotic entry.
Tavernier N, Thomas Y, Vigneron S, Maisonneuve P, Orlicky S, Mader P, Regmi SG, Van Hove L, Levinson NM, Gasmi-Seabrook G, Joly N, Poteau M, Velez-Aguilera G, Gavet O, Castro A, Dasso M, Lorca T, Sicheri F, Pintard L. Tavernier N, et al. Nat Commun. 2021 Mar 26;12(1):1899. doi: 10.1038/s41467-021-21922-w. Nat Commun. 2021. PMID: 33771996 Free PMC article. - Cyclin A-cdk1-Dependent Phosphorylation of Bora Is the Triggering Factor Promoting Mitotic Entry.
Vigneron S, Sundermann L, Labbé JC, Pintard L, Radulescu O, Castro A, Lorca T. Vigneron S, et al. Dev Cell. 2018 Jun 4;45(5):637-650.e7. doi: 10.1016/j.devcel.2018.05.005. Dev Cell. 2018. PMID: 29870721 - Playing polo during mitosis: PLK1 takes the lead.
Combes G, Alharbi I, Braga LG, Elowe S. Combes G, et al. Oncogene. 2017 Aug 24;36(34):4819-4827. doi: 10.1038/onc.2017.113. Epub 2017 Apr 24. Oncogene. 2017. PMID: 28436952 Review. - Aurora-PLK1 cascades as key signaling modules in the regulation of mitosis.
Joukov V, De Nicolo A. Joukov V, et al. Sci Signal. 2018 Aug 14;11(543):eaar4195. doi: 10.1126/scisignal.aar4195. Sci Signal. 2018. PMID: 30108183 Review.
Cited by
- Multiscale models of cell signaling.
Bajikar SS, Janes KA. Bajikar SS, et al. Ann Biomed Eng. 2012 Nov;40(11):2319-27. doi: 10.1007/s10439-012-0560-1. Epub 2012 Apr 3. Ann Biomed Eng. 2012. PMID: 22476894 Free PMC article. Review. - High-throughput analysis of peptide-binding modules.
Liu BA, Engelmann BW, Nash PD. Liu BA, et al. Proteomics. 2012 May;12(10):1527-46. doi: 10.1002/pmic.201100599. Proteomics. 2012. PMID: 22610655 Free PMC article. Review. - Domain specificity of MAP3K family members, MLK and Tak1, for JNK signaling in Drosophila.
Stronach B, Lennox AL, Garlena RA. Stronach B, et al. Genetics. 2014 Jun;197(2):497-513. doi: 10.1534/genetics.113.160937. Epub 2014 Jan 15. Genetics. 2014. PMID: 24429281 Free PMC article. - Evolution and functional cross-talk of protein post-translational modifications.
Beltrao P, Bork P, Krogan NJ, van Noort V. Beltrao P, et al. Mol Syst Biol. 2013 Dec 22;9:714. doi: 10.1002/msb.201304521. Print 2013. Mol Syst Biol. 2013. PMID: 24366814 Free PMC article. Review. - What's that gene (or protein)? Online resources for exploring functions of genes, transcripts, and proteins.
Hutchins JR. Hutchins JR. Mol Biol Cell. 2014 Apr;25(8):1187-201. doi: 10.1091/mbc.E13-10-0602. Mol Biol Cell. 2014. PMID: 24723265 Free PMC article. Review.
References
- Manning G, Whyte DB, Martinez R, Hunter T, Sudarsanam S. The protein kinase complement of the human genome. Science. 2002;298:1912–1934. - PubMed
- Ubersax JA, Ferrell JE., Jr. Mechanisms of specificity in protein phosphorylation. Nat. Rev. Mol. Cell Biol. 2007;8:530–541. - PubMed
- Linding R, Jensen LJ, Ostheimer GJ, van Vugt MA, Jorgensen C, Miron IM, Diella F, Colwill K, Taylor L, Elder K, Metalnikov P, Nguyen V, Pasculescu A, Jin J, Park JG, Samson LD, Woodgett JR, Russell RB, Bork P, Yaffe MB, Pawson T. Systematic discovery of in vivo phosphorylation networks. Cell. 2007;129:1415–1426. - PMC - PubMed
- Alberts B. Molecular Biology of the Cell. Garland Science; New York: 2002. pp. 1027–1062.
- Carmena M, Earnshaw WC. The cellular geography of aurora kinases. Nat. Rev. Mol. Cell Biol. 2003;4:842–854. - PubMed
Publication types
MeSH terms
Substances
Grants and funding
- 082828/WT_/Wellcome Trust/United Kingdom
- 078020/WT_/Wellcome Trust/United Kingdom
- A7820/CRUK_/Cancer Research UK/United Kingdom
- R01 GM060594/GM/NIGMS NIH HHS/United States
- U54 CA112967/CA/NCI NIH HHS/United States
- CA-112967/CA/NCI NIH HHS/United States
- P50 GM068762/GM/NIGMS NIH HHS/United States
- GM-60594/GM/NIGMS NIH HHS/United States
- 069035/WT_/Wellcome Trust/United Kingdom
- ES-015339/ES/NIEHS NIH HHS/United States
- R01 ES015339/ES/NIEHS NIH HHS/United States
- A9363/CRUK_/Cancer Research UK/United Kingdom
- MC_U117584228/MRC_/Medical Research Council/United Kingdom
- GM-68762/GM/NIGMS NIH HHS/United States
- 06-0029/AICR_/Worldwide Cancer Research/United Kingdom
- 06-0407/AICR_/Worldwide Cancer Research/United Kingdom
LinkOut - more resources
Full Text Sources
Other Literature Sources
Miscellaneous
