Similarity of mouse perivascular and brown adipose tissues and their resistance to diet-induced inflammation - PubMed (original) (raw)
Similarity of mouse perivascular and brown adipose tissues and their resistance to diet-induced inflammation
Timothy P Fitzgibbons et al. Am J Physiol Heart Circ Physiol. 2011 Oct.
Abstract
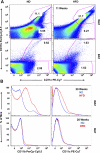
Thoracic perivascular adipose tissue (PVAT) is a unique adipose depot that likely influences vascular function and susceptibility to pathogenesis in obesity and the metabolic syndrome. Surprisingly, PVAT has been reported to share characteristics of both brown and white adipose, but a detailed direct comparison to interscapular brown adipose tissue (BAT) has not been performed. Here we show by full genome DNA microarray analysis that global gene expression profiles of PVAT are virtually identical to BAT, with equally high expression of Ucp-1, Cidea, and other genes known to be uniquely or very highly expressed in BAT. PVAT and BAT also displayed nearly identical phenotypes upon immunohistochemical analysis, and electron microscopy confirmed that PVAT contained multilocular lipid droplets and abundant mitochondria. Compared with white adipose tissue (WAT), PVAT and BAT from C57BL6/J mice fed a high-fat diet for 13 wk had markedly lower expression of immune cell-enriched mRNAs, suggesting resistance to obesity-induced inflammation. Indeed, staining of BAT and PVAT for macrophage markers (F4/80 and CD68) in obese mice showed virtually no macrophage infiltration, and FACS analysis of BAT confirmed the presence of very few CD11b(+)/CD11c(+) macrophages in BAT (1.0%) compared with WAT (31%). In summary, murine PVAT from the thoracic aorta is virtually identical to interscapular BAT, is resistant to diet-induced macrophage infiltration, and thus may play an important role in protecting the vascular bed from inflammatory stress.
Figures
Fig. 1.
Cidea and Ucp-1 are highly expressed in interscapular brown adipose tissue (BAT) and perivascular adipose from the aortic arch (PVAT) independently of obesity. A, B, C, and D: Cidea, Ucp-1, Acrp30, and Ppar_γ_2 expression in normal diet (ND) and high-fat diet (HFD) mice. Quantitative PCR was performed on total RNA isolated from inguinal (SAT), epididymal (VAT), BAT, and PVAT. Expression levels were calculated with the 2−ΔΔCt method using 36b4 as the reference gene and normalized to expression in SAT from ND conditions. Ucp-1 expression is shown in log10 scale. AU, arbitrary units. ND: n = 12 white; HFD: n = 12, black. Results are means ± SE. ***P < 0.001 vs. SAT ND; #P < 0.05. ND vs. HFD of the same fat depot using two-way ANOVA and the Bonferonni correction; P < 0.05 vs. SAT ND.
Fig. 2.
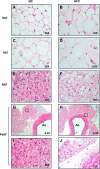
PVAT appears morphologically similar to BAT. Fat was harvested from SAT (A and B), VAT (C and D), interscapular BAT (E and F), and PVAT (G–J) from the lesser curvature of the aortic arch from ND and HFD fed mice and then fixed in formalin. Tissues were stained with hematoxylin and eosin and visualized at ×25. Images G and H are low magnification images (×6.3) of I and J. Ao, aortic lumen.
Fig. 3.
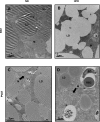
Transmission electron microscopy reveals many similarities between PVAT and BAT. Sections of brown (A and B) and perivascular adipose (C and D) were taken and stained with osmium tetroxide. In ND conditions, brown (A) and perivascular adipose (C) appear very similar with mulitilocular lipid droplets and abundant mitochondria. Two prominent changes were noted in high-fat feeding conditions; lipid droplets in BAT, but not PVAT, lose their avidity for osmium textroxide (B), and mitochondria become swollen with unfolded cristae (D); the latter effect was more prominent in perivascular adipose but also observed in brown adipose after a longer duration of HFD. LD, lipid droplet; M, mitochondria; EC, endothelial cell; RBC, red blood cell. Magnification: ×7900; scale bar = 2 μm.
Fig. 4.
Microarray analysis reveals that PVAT is more similar to BAT than SAT or VAT. Microarray Computational Environment (MACE) database was queried in ND and HFD conditions for genes with a >2.0 fold change in expression at P < 0.05 level of significance between adipose depots. In ND conditions, PVAT was very similar to BAT, with differential expression of only 228 genes (0.79% of genes); in contrast, expression of 1,229 genes was differentially regulated when comparing PVAT and SAT (4.2% of genes). After high-fat feeding, PVAT became more similar to white adipose, as the number of genes differentially regulated between PVAT and SAT was reduced to 855 (2.9% of genes). White arrows, upregulated; black arrows, downregulated.
Fig. 5.
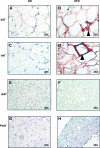
PVAT and BAT are resistant to inflammation after 13 wk of HFD. SAT (A and B), VAT (C and D), BAT (E and F), and PVAT (G and H) from the aortic arch was harvested from lean and obese mice (n = 3 per group). Samples were fixed in 4% formalin, sectioned, and stained with a rat anti-mouse F4/80 primary antibody (ABd Serotec). Staining was visualized with a horseradish-peroxidase-linked rabbit anti-rat secondary antibody. Abundant macrophages were seen predominantly in VAT, but also SAT, forming crown-like structures (arrowheads). No macrophages were seen in BAT or PVAT (magnification: ×25).
Fig. 6.
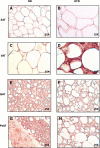
Perivascular and brown adipose tissue are resistant to inflammation after 20 wk of HFD. A second cohort of mice was continued on HFD for 20 wk. SAT (A and B), VAT (C and D), BAT (E and F), and PVAT (G and H) from the aortic arch was harvested from lean and obese mice (n = 3 per group). Samples were fixed in 4% formalin, sectioned, and stained with a rat anti-mouse F4/80 primary antibody (ABd Serotec). Staining was visualized with a HRP linked rabbit anti-rat secondary antibody. Again, abundant macrophages were seen in VAT (D). No macrophages were seen in BAT (F) or PVAT (H) despite distortion and enlargement of lipid droplet morphology (magnification: ×25).
Fig. 7.
BAT is resistant to inflammation after 11 and 20 wk of HFD. A: after 11 wk of HFD, the stromal vascular fraction was isolated from VAT and BAT and stained with CD31-PE, CD11b-PerCp Cy5.5, and CD11c-PE Cy7. Samples were analyzed on a LSRII flow cytometer, gating for CD31-negative cells. High-fat feeding resulted in a significant increase in the percentage of CD11b- and CD11c-positive cells in the SVF of visceral but not brown adipose (31.7 vs. 1.03%). B: similar results were obtained after 20 wk of HFD. Results represent 3 independent experiments.
Similar articles
- Divergent phenotype of rat thoracic and abdominal perivascular adipose tissues.
Padilla J, Jenkins NT, Vieira-Potter VJ, Laughlin MH. Padilla J, et al. Am J Physiol Regul Integr Comp Physiol. 2013 Apr 1;304(7):R543-52. doi: 10.1152/ajpregu.00567.2012. Epub 2013 Feb 6. Am J Physiol Regul Integr Comp Physiol. 2013. PMID: 23389108 Free PMC article. - Decreased brown fat markedly enhances susceptibility to diet-induced obesity, diabetes, and hyperlipidemia.
Hamann A, Flier JS, Lowell BB. Hamann A, et al. Endocrinology. 1996 Jan;137(1):21-9. doi: 10.1210/endo.137.1.8536614. Endocrinology. 1996. PMID: 8536614 - Leucine deprivation decreases fat mass by stimulation of lipolysis in white adipose tissue and upregulation of uncoupling protein 1 (UCP1) in brown adipose tissue.
Cheng Y, Meng Q, Wang C, Li H, Huang Z, Chen S, Xiao F, Guo F. Cheng Y, et al. Diabetes. 2010 Jan;59(1):17-25. doi: 10.2337/db09-0929. Epub 2009 Oct 15. Diabetes. 2010. PMID: 19833890 Free PMC article. - Targeting white, brown and perivascular adipose tissue in atherosclerosis development.
van Dam AD, Boon MR, Berbée JFP, Rensen PCN, van Harmelen V. van Dam AD, et al. Eur J Pharmacol. 2017 Dec 5;816:82-92. doi: 10.1016/j.ejphar.2017.03.051. Epub 2017 Mar 24. Eur J Pharmacol. 2017. PMID: 28347739 Review. - PVAT and Its Relation to Brown, Beige, and White Adipose Tissue in Development and Function.
Hildebrand S, Stümer J, Pfeifer A. Hildebrand S, et al. Front Physiol. 2018 Feb 6;9:70. doi: 10.3389/fphys.2018.00070. eCollection 2018. Front Physiol. 2018. PMID: 29467675 Free PMC article. Review.
Cited by
- Adipogenesis.
Sarjeant K, Stephens JM. Sarjeant K, et al. Cold Spring Harb Perspect Biol. 2012 Sep 1;4(9):a008417. doi: 10.1101/cshperspect.a008417. Cold Spring Harb Perspect Biol. 2012. PMID: 22952395 Free PMC article. Review. - Mineralocorticoid Receptor in Myeloid Cells Mediates Angiotensin II-Induced Vascular Dysfunction in Female Mice.
Manrique-Acevedo C, Padilla J, Naz H, Woodford ML, Ghiarone T, Aroor AR, Hulse JL, Cabral-Amador FJ, Martinez-Diaz V, Hans CP, Whaley-Connell A, Martinez-Lemus LA, Lastra G. Manrique-Acevedo C, et al. Front Physiol. 2021 Mar 29;12:588358. doi: 10.3389/fphys.2021.588358. eCollection 2021. Front Physiol. 2021. PMID: 33854438 Free PMC article. - Pathological Conversion of Mouse Perivascular Adipose Tissue by Notch Activation.
Boucher JM, Ryzhova L, Harrington A, Davis-Knowlton J, Turner JE, Cooper E, Maridas D, Ryzhov S, Rosen CJ, Vary CPH, Liaw L. Boucher JM, et al. Arterioscler Thromb Vasc Biol. 2020 Sep;40(9):2227-2243. doi: 10.1161/ATVBAHA.120.314731. Epub 2020 Jul 9. Arterioscler Thromb Vasc Biol. 2020. PMID: 32640901 Free PMC article. - The influence of perivascular adipose tissue on vascular homeostasis.
Szasz T, Bomfim GF, Webb RC. Szasz T, et al. Vasc Health Risk Manag. 2013;9:105-16. doi: 10.2147/VHRM.S33760. Epub 2013 Mar 28. Vasc Health Risk Manag. 2013. PMID: 23576873 Free PMC article. Review. - Site-specific impairment of perivascular adipose tissue on advanced atherosclerotic plaques using multimodal nonlinear optical imaging.
Kim S, Lee ES, Lee SW, Kim YH, Lee CH, Jo DG, Kim SH. Kim S, et al. Proc Natl Acad Sci U S A. 2019 Sep 3;116(36):17765-17774. doi: 10.1073/pnas.1902007116. Epub 2019 Aug 19. Proc Natl Acad Sci U S A. 2019. PMID: 31427531 Free PMC article.
References
- Bobryshev YV, Lord RS. Vascular-associated lymphoid tissue (VALT) involvement in aortic aneurysm. Atherosclerosis 154: 15–21, 2001 - PubMed
- Bolstad BM, Irizarry RA, Astrand M, Speed TP. A comparison of normalization methods for high density oligonucleotide array data based on variance and bias. Bioinformatics 19: 185–193, 2003 - PubMed
- Cannon B, Nedergaard J. Brown adipose tissue: function and physiological significance. Physiol Rev 84: 277–359, 2004 - PubMed
- Choi HY, Kim S, Yang SJ, Yoo HJ, Seo JA, Kim SG, Kim NH, Baik SH, Choi DS, Choi KM. Association of adiponectin, resistin, and vascular inflammation: analysis with 18F-fluorodeoxyglucose positron emission tomography. Arterioscler Thromb Vasc Biol 31: 944–949, 2011 - PubMed
Publication types
MeSH terms
Substances
Grants and funding
- DK-30898/DK/NIDDK NIH HHS/United States
- P30 DK032520/DK/NIDDK NIH HHS/United States
- R01 DK060837/DK/NIDDK NIH HHS/United States
- DK-32520/DK/NIDDK NIH HHS/United States
- DK-60837/DK/NIDDK NIH HHS/United States
- R37 DK030898/DK/NIDDK NIH HHS/United States
- R01 DK030898/DK/NIDDK NIH HHS/United States
LinkOut - more resources
Full Text Sources
Other Literature Sources
Molecular Biology Databases
Research Materials

