BLAST Ring Image Generator (BRIG): simple prokaryote genome comparisons - PubMed (original) (raw)
Comparative Study
BLAST Ring Image Generator (BRIG): simple prokaryote genome comparisons
Nabil-Fareed Alikhan et al. BMC Genomics. 2011.
Abstract
Background: Visualisation of genome comparisons is invaluable for helping to determine genotypic differences between closely related prokaryotes. New visualisation and abstraction methods are required in order to improve the validation, interpretation and communication of genome sequence information; especially with the increasing amount of data arising from next-generation sequencing projects. Visualising a prokaryote genome as a circular image has become a powerful means of displaying informative comparisons of one genome to a number of others. Several programs, imaging libraries and internet resources already exist for this purpose, however, most are either limited in the number of comparisons they can show, are unable to adequately utilise draft genome sequence data, or require a knowledge of command-line scripting for implementation. Currently, there is no freely available desktop application that enables users to rapidly visualise comparisons between hundreds of draft or complete genomes in a single image.
Results: BLAST Ring Image Generator (BRIG) can generate images that show multiple prokaryote genome comparisons, without an arbitrary limit on the number of genomes compared. The output image shows similarity between a central reference sequence and other sequences as a set of concentric rings, where BLAST matches are coloured on a sliding scale indicating a defined percentage identity. Images can also include draft genome assembly information to show read coverage, assembly breakpoints and collapsed repeats. In addition, BRIG supports the mapping of unassembled sequencing reads against one or more central reference sequences. Many types of custom data and annotations can be shown using BRIG, making it a versatile approach for visualising a range of genomic comparison data. BRIG is readily accessible to any user, as it assumes no specialist computational knowledge and will perform all required file parsing and BLAST comparisons automatically.
Conclusions: There is a clear need for a user-friendly program that can produce genome comparisons for a large number of prokaryote genomes with an emphasis on rapidly utilising unfinished or unassembled genome data. Here we present BRIG, a cross-platform application that enables the interactive generation of comparative genomic images via a simple graphical-user interface. BRIG is freely available for all operating systems at http://sourceforge.net/projects/brig/.
Figures
Figure 1
BRIG output image of a simulated draft E. coli O157:H7 str. Sakai genome. Figure 1 shows a draft E. coli genome compared against 27 other prokaryote genomes (the full list of genomes is described in Table 1). The reference genome is an ordered set of contigs, assembled using GS De Novo Assembler (454 Life Sciences/Roche) version 2.3, from simulated sequencing reads generated by MetaSim [21] based on the E. coli O157:H7 str. Sakai genome [GenBank:BA000007]. After assembly contigs were ordered against the complete E. coli O157:H7 Sakai genome using Mauve [7]. The innermost rings show GC skew (purple/green) and GC content (black). The third innermost ring shows genome coverage (brown); genome regions with coverage more than one standard deviation (~ 41) from the mean coverage (~ 94) are represented as blue spikes. Contig boundaries are shown outside this ring as alternating red and blue bars. The remaining rings show BLAST comparisons of 27 other complete E. coli and Salmonella genomes against the simulated draft genome assembly (in several cases, multiple genome comparisons are collapsed into a single ring, Table 1). The outermost ring highlights the Sakai prophage, and prophage-like (Sp & SpLE) regions as described by Hayashi et al. [20], shown in navy blue and fuchsia, respectively. SpLE 4, containing the locus of enterocyte effacement, is shown in green.
Figure 2
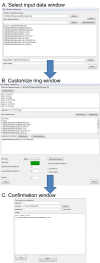
Screenshots of BRIG's graphical user interfaces. Screenshots of BRIG's three main graphical user interfaces: A. The "select input data" window where users are able to specify the reference sequences, query sequences, and output folder. B. The "customise ring" window where one or more query sequence files, that were loaded in the previous window, are chosen for each concentric ring. Image drawing configurations, including ring colour, size, identity thresholds and legend text can also be specified. Custom annotations, graphs, or a ring showing contig boundary information can be added at this point. C. In the "confirmation" window settings are confirmed and submitted to BRIG to perform the genome comparisons and image rendering. Progress is written to a console box. From any window prior to job submission, configurations for BLAST or CGview can be altered via the preferences pull-down menu.
Figure 3
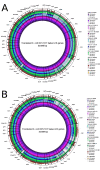
Using BRIG to compare a multi-sequence reference against complete genomes or unassembled sequence reads. BRIG image showing the presence, absence and variation of individual genes from the E. coli O157:H7 str. Sakai Locus of Enterocyte Effacement (LEE) in related pathogens and E. coli K12, a non-pathogenic strain of E. coli known to lack the LEE region. Images show a multi-sequence reference consisting of the translated nucleotide sequences of the 41 LEE protein-coding genes, in order, retrieved from the E. coli O157:H7 str. Sakai genome [GenBank: BA000007]. Labels around the outside of each circular image correspond to LEE gene names. In both panels the rings display BLAST× comparisons of 10 bacterial genomes with the translated nucleotide sequences of the LEE genes: A. Comparison with complete genome sequences (Table 2). B. Comparison with unassembled, simulated 100 base-pair Illumina reads based on the complete genome sequences used in Figure 3A. The image is scaled to the nucleotide length of the genes. Long tick marks on the outer and inner circumference of the ring indicate increments of 1 kilobase-pairs and short tick marks indicate 200 base-pairs.
Figure 4
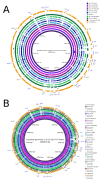
Using BRIG to map unassembled sequence reads against a complete genome reference. BRIG images showing genomic regions shared by E. coli O157:H7 str. Sakai and related bacteria. The reference sequence is E. coli O157:H7 str. Sakai [GenBank: BA000007] with individual rings representing 10 genomes (Table 3). A. Rings show depth of coverage from unassembled, simulated 100 base-pair Illumina reads mapped onto the E. coli O157:H7 str. Sakai genome using the BWA [24] read-mapping application. Graph height in each ring is proportional to the number of reads mapping at each nucleotide position in the reference genome from 0 to 30× coverage. Regions with a genome coverage greater than 30× are shown as solid blue bands. B. For comparison, rings show BLASTn comparisons between the same genome sequences used in panel A (Table 3) against the E. coli O157:H7 str. Sakai genome. Long tick marks on the outer and inner circumference of the ring indicate increments of 500 kilobase-pairs and short tick marks indicate 100 kilobase-pairs. E. coli O157:H7 str. Sakai prophage and prophage-like (Sp & SpLE) regions are annotated in black and blue, respectively, using co-ordinates taken from Hayashi et al. [20].
Similar articles
- PanWeb: A web interface for pan-genomic analysis.
Pantoja Y, Pinheiro K, Veras A, Araújo F, Lopes de Sousa A, Guimarães LC, Silva A, Ramos RTJ. Pantoja Y, et al. PLoS One. 2017 May 24;12(5):e0178154. doi: 10.1371/journal.pone.0178154. eCollection 2017. PLoS One. 2017. PMID: 28542514 Free PMC article. - Easyfig: a genome comparison visualizer.
Sullivan MJ, Petty NK, Beatson SA. Sullivan MJ, et al. Bioinformatics. 2011 Apr 1;27(7):1009-10. doi: 10.1093/bioinformatics/btr039. Epub 2011 Jan 28. Bioinformatics. 2011. PMID: 21278367 Free PMC article. - DraGnET: software for storing, managing and analyzing annotated draft genome sequence data.
Duncan S, Sirkanungo R, Miller L, Phillips GJ. Duncan S, et al. BMC Bioinformatics. 2010 Feb 22;11:100. doi: 10.1186/1471-2105-11-100. BMC Bioinformatics. 2010. PMID: 20175920 Free PMC article. - An Experimental Approach to Genome Annotation: This report is based on a colloquium sponsored by the American Academy of Microbiology held July 19-20, 2004, in Washington, DC.
[No authors listed] [No authors listed] Washington (DC): American Society for Microbiology; 2004. Washington (DC): American Society for Microbiology; 2004. PMID: 33001599 Free Books & Documents. Review. - Assembly, Annotation, and Comparative Genomics in PATRIC, the All Bacterial Bioinformatics Resource Center.
Wattam AR, Brettin T, Davis JJ, Gerdes S, Kenyon R, Machi D, Mao C, Olson R, Overbeek R, Pusch GD, Shukla MP, Stevens R, Vonstein V, Warren A, Xia F, Yoo H. Wattam AR, et al. Methods Mol Biol. 2018;1704:79-101. doi: 10.1007/978-1-4939-7463-4_4. Methods Mol Biol. 2018. PMID: 29277864 Review.
Cited by
- First documentation of a clinical multidrug-resistant Enterobacter chuandaensis ST2493 isolate co-harboring blaNDM-1 and two blaKPC-2 bearing plasmids.
Chen R, Li C, Xu H, Liu R, Ge H, Qiao J, Liu Y, Liu X, Fang L, Shen Y, Guo X. Chen R, et al. Sci Rep. 2024 Nov 5;14(1):26817. doi: 10.1038/s41598-024-78163-2. Sci Rep. 2024. PMID: 39500966 Free PMC article. - Characterization of a multidrug-resistant, novel Bacteroides genomospecies.
Salipante SJ, Kalapila A, Pottinger PS, Hoogestraat DR, Cummings L, Duchin JS, Sengupta DJ, Pergam SA, Cookson BT, Butler-Wu SM. Salipante SJ, et al. Emerg Infect Dis. 2015 Jan;21(1):95-8. doi: 10.3201/eid2101.140662. Emerg Infect Dis. 2015. PMID: 25529016 Free PMC article. - Isolation and Characterization of Lytic Bacteriophages Active against Clinical Strains of E. coli and Development of a Phage Antimicrobial Cocktail.
Alexyuk P, Bogoyavlenskiy A, Alexyuk M, Akanova K, Moldakhanov Y, Berezin V. Alexyuk P, et al. Viruses. 2022 Oct 28;14(11):2381. doi: 10.3390/v14112381. Viruses. 2022. PMID: 36366479 Free PMC article. - Genomic Characterization of Two Shiga Toxin-Converting Bacteriophages Induced From Environmental Shiga Toxin-Producing Escherichia coli.
Zhang Y, Liao YT, Salvador A, Wu VCH. Zhang Y, et al. Front Microbiol. 2021 Feb 25;12:587696. doi: 10.3389/fmicb.2021.587696. eCollection 2021. Front Microbiol. 2021. PMID: 33716997 Free PMC article. - Metagenomic and paleopathological analyses of a historic documented collection explore ancient dental calculus as a diagnostic tool.
Austin RM, Honap TP, Mann AE, Hübner A, DeGaglia CMS, Warinner C, Zuckerman MK, Hofman CA. Austin RM, et al. Sci Rep. 2024 Jun 26;14(1):14720. doi: 10.1038/s41598-024-64818-7. Sci Rep. 2024. PMID: 38926415 Free PMC article.
References
- Censini S, Lange C, Xiang ZY, Crabtree JE, Ghiara P, Borodovsky M, Rappuoli R, Covacci A. cag, a pathogenicity island of Helicobacter pylori, encodes type I-specific and disease-associated virulence factors. P Natl Acad Sci USA. 1996;93:14648–14653. doi: 10.1073/pnas.93.25.14648. - DOI - PMC - PubMed
Publication types
MeSH terms
LinkOut - more resources
Full Text Sources
Other Literature Sources
Research Materials


