Hierarchical IL-5 expression defines a subpopulation of highly differentiated human Th2 cells - PubMed (original) (raw)
Hierarchical IL-5 expression defines a subpopulation of highly differentiated human Th2 cells
Bhaskar Upadhyaya et al. J Immunol. 2011.
Abstract
Each of the three Th2 cytokine genes, IL-4, IL-5, and IL-13, has different functions. We hypothesized that Th2 heterogeneity could yield Th2 subpopulations with different cytokine expression and effector functions. Using multiple approaches, we demonstrate that human Th2 cells are composed of two major subpopulations: a minority IL-5(+) (IL-5(+), IL-4(+), IL-13(+)) and majority IL-5(-) Th2 (IL-5(-), IL-4(+), IL-13(+)) population. IL-5(+) Th2 cells comprised only 20% of all Th2 cells. Serial rounds of in vitro differentiation initially yielded IL-5(-) Th2, but required multiple rounds of differentiation to generate IL-5(+) Th2 cells. IL-5(+) Th2 cells expressed less CD27 and greater programmed cell death-1 than IL-5(-) Th2 cells, consistent with their being more highly differentiated, Ag-exposed memory cells. IL-5(+) Th2 cells expressed greater IL-4, IL-13, and GATA-3 relative to IL-5(-) Th2 cells. GATA-3 and H3K4me(3) binding to the IL5 promoter (IL5p) was greater in IL-5(+) relative to IL-5(-) Th2 cells, whereas there was no difference in their binding to the IL4p and IL13p. Conversely, H3K27me(3) binding to the IL5p was greater in IL-5(-) Th2 cells. These findings demonstrate Th2 lineage heterogeneity, in which the IL5 gene is regulated in a hierarchical manner relative to other Th2 genes. IL-5(+) Th2 cells are phenotypically distinct and have epigenetic changes consistent with greater IL5p accessibility. Recurrent antigenic exposure preferentially drives the differentiation of IL-5(+) Th2 cells. These results demonstrate that IL-5(+) and IL-5(-) Th2 cells, respectively, represent more and less highly differentiated Th2 cell subpopulations. Such Th2 subpopulations may differentially contribute to Th2-driven pathology.
Figures
Fig 1
IL-5 is expressed by a minority subpopulation of Th2 cells. (A, B) PBMC were activated with the indicated stimuli, stained for intracellular cytokines and after gating on CD4 T cells, (A) IL-5 vs. IL-13 or (B) IL-4 vs. IL-13 dots plots generated; results are representative of a minimum of 6 donors and/or independent experiments for each condition. (C-G) Boolean analysis was used to quantitate the relative proportions of Th2 cytokine expressing subpopulations according to the color scheme noted. Each pieslice represents the median proportion of the total CD4+ Th2 response for each condition. The proportional contribution of Th2 subpopulations in PMA/ionomycin activated cells from (D) 6 healthy non-atopic and (E) 8 EGID subjects, (F) grouped dust mite and Fel dI Ag specificresponses from 5 allergic asthmaticsubjects, or (G) IL-4 cytokine secretion assay sorted cell lines from 4 healthy non-atopic and 2 EGID subjects are shown. The arc in (D) represents the total fraction of Th2 cells expressing IL-5. (H, I) After PMA/ionomycin activation and ICCS, the MFI of (H) IL-4 and (I) IL-13 staining was determined for the noted subpopulations; bars represent median values, significance determined using one-way ANOVA. Individual non-atopic control and EGID subjects (n=6 and 8, respectively) are indicated as open triangles and closed circles, respectively.
Fig 2
IL-5+ and IL-5− Th2 subpopulations retain their respective phenotype. SEB activated PBMC were dual stained with IL-4 and IL-5 using the cytokine secretion assay, bead selected for IL-4 and (A) sorted for IL-4+, IL-5+ and IL-4+, IL-5− cells (respective boxed gates). IL-5+ (B, C) and IL-5− (D, E) sorted Th2 cells were expanded in vitro with IL-2 for 7 d and analyzed by ICCS for the indicated Th2 cytokine pairs. (H) In this and subsequent figures, the noted Boolean analysis was used to quantify cytokine expressing subpopulations according to the color scheme noted. (F, G) The median proportions of Th2 subpopulations for (F) IL-4+, IL-5+ and (G) IL-4+, IL-5− sorted cell lines (n = 5 independent experiments). Statistical significance was determined using the Mann-Whitney U test.
Fig 3
Clonal inheritance of Th2 cytokine expression. (A-G) IL-5+ and IL-4+, 5− cytokine secretion assay sorted cells were cloned and analyzed by ICCS. (A, B) Representative clones in each column were analyzed for the indicated Th2 cytokine pairs. (C, D) Boolean analysis of clonal cytokine expression by (C) IL-5+ and (D) IL-4+, IL-5− sorted clones; each bar corresponds to the fraction of cytokine expression in an individual clone according to the color scheme in K. Results represent 99 IL-5+ and 106 IL-4+, IL-5− sorted clones combined from 3 independent experiments. (E, F) The IL-4+, IL-5+, IL-13+and IL-4+, IL-5−, IL-13+ subpopulations within the clones from (D) were gated upon and the IL-4 and IL-13 MFI determined for each and plotted as the ratio to the MFI of control unstimulated polyclonal Th2 cells. (G-J) Th2 clones with homogeneous IL-5+ and IL-5− phenotypes were selected according to their ICCS for IL-5 (G) and further analyzed by qPCR for IL5, IL4 and IL13, respectively.Horizontal bars represent the median values. Statistical significance was determined using the Mann-Whitney U test.
Fig 4
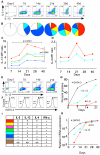
The generation of IL-5+ Th2 cells requires multiple rounds of differentiation. (A-H) Naïve CD4 T cells underwent serial rounds of in vitro Th2 differentiation and were analyzed for Th2 cytokine expressionby ICCS at each time point noted. (A) IL-5 vs. IL-13 plots from a representative experiment. (B) Boolean analysis of combined results of cytokine expression. For each Th2 subpopulation and time point, (C) IL-13 and (D) IL-4 MFI ratio was determined. At the indicated time points, cells were stained for (E) IL-5 vs. IL-13 or (F) GATA-3 and the percentage of positive staining cells (IL-5, IL-13 and GATA-3) or MFI (GATA-3) determined. Combined results of (G) ICCS and (H) qPCR for the indicated time points and analytes; results in (H) were normalized to the day 40 values. (I) Subpopulations in B-D are according to the color scheme shown in I. Results in B-D, G, H are median values from 3 independent experiments; results in A, E, and F are representative of 3 independent experiments. Statistical significance in C was determined using atwo-way ANOVA test.
Fig 5
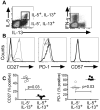
IL-5+ Th2 cells are highly differentiated T cells. PBMC were activated for 6h ex vivo with PMA/ionomycin and viable CD4 T cells were simultaneously stained for IL-5, IL-13, IFN-γ and the indicated T cell differentiation markers. (A) After gating on IL-5+, IL-13+ (thick black line); IL-5−, IL-13+ (thin black line); or IFN-γ+, IL-13− cells (thick gray line), (B) CD27, PD-1, and CD57 histograms for each subset were generated and displayed using the same symbols. (C) Combined results from 5 subjects showing CD27 and PD-1 expression by IL-5+, IL-13+ (filled squares) and IL-5−, IL-13+ (open circles) Th2 cells; bars represent median values. Statistical significance was determined using aMann-Whitney U test.
Fig 6
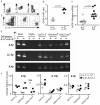
Th2 subpopulations display epigenetic changes consistent with differential IL-5 promoter accessibility. (A, B) CD4 T cells were activated with PMA/ionomycin for 6 h ex vivo and simultaneously stained for GATA-3, IL-5, IL-13 and IFN-γ. (B) After gating on IL-5+, IL-13+ or IL-5−, IL-13+ Th2 cells, GATA-3 MFI was determined for 4 subjects. (C) Selected IL-5− and IL-5+ Th2 clones from Fig. 3G were further analyzed by qPCR for_GATA3_. (D) 12-day dust mite specific Th2 cell lines were activated in vitro, stained using ICCS (left plot) and sorted for IL-5+, IL-13+ cells and IL-5−, IL-13+ cells (respective boxed gates). Post sort IL-5+ and IL-5− populations are shown in the center and right plots, respectively. (E) Sorted IL-5+, IL-13+ and IL-5−, IL-13+ Th2 subpopulations, respectively noted as “+” and “−”, were analyzed by ChIP with antibodies to GATA-3, H3K4me3, H3K27me3, and control mouse IgG1. Binding of the corresponding proteins to the noted cytokine gene promoters (p) was quantitated using PCR. (F) Combined ChIP results from 3 dust mite specific cell lines, each derived from a different allergic asthmatic subject.
Similar articles
- Enforced expression of GATA-3 in transgenic mice inhibits Th1 differentiation and induces the formation of a T1/ST2-expressing Th2-committed T cell compartment in vivo.
Nawijn MC, Dingjan GM, Ferreira R, Lambrecht BN, Karis A, Grosveld F, Savelkoul H, Hendriks RW. Nawijn MC, et al. J Immunol. 2001 Jul 15;167(2):724-32. doi: 10.4049/jimmunol.167.2.724. J Immunol. 2001. PMID: 11441076 - Genetic reprogramming of primary human T cells reveals functional plasticity in Th cell differentiation.
Sundrud MS, Grill SM, Ni D, Nagata K, Alkan SS, Subramaniam A, Unutmaz D. Sundrud MS, et al. J Immunol. 2003 Oct 1;171(7):3542-9. doi: 10.4049/jimmunol.171.7.3542. J Immunol. 2003. PMID: 14500650 - Interferons direct Th2 cell reprogramming to generate a stable GATA-3(+)T-bet(+) cell subset with combined Th2 and Th1 cell functions.
Hegazy AN, Peine M, Helmstetter C, Panse I, Fröhlich A, Bergthaler A, Flatz L, Pinschewer DD, Radbruch A, Löhning M. Hegazy AN, et al. Immunity. 2010 Jan 29;32(1):116-28. doi: 10.1016/j.immuni.2009.12.004. Epub 2010 Jan 14. Immunity. 2010. PMID: 20079668 - The Metabolic Requirements of Th2 Cell Differentiation.
Stark JM, Tibbitt CA, Coquet JM. Stark JM, et al. Front Immunol. 2019 Sep 27;10:2318. doi: 10.3389/fimmu.2019.02318. eCollection 2019. Front Immunol. 2019. PMID: 31611881 Free PMC article. Review. - 'All things considered': transcriptional regulation of T helper type 2 cell differentiation from precursor to effector activation.
Zeng WP. Zeng WP. Immunology. 2013 Sep;140(1):31-8. doi: 10.1111/imm.12121. Immunology. 2013. PMID: 23668241 Free PMC article. Review.
Cited by
- Distinct roles of ORAI1 in T cell-mediated allergic airway inflammation and immunity to influenza A virus infection.
Wang YH, Noyer L, Kahlfuss S, Raphael D, Tao AY, Kaufmann U, Zhu J, Mitchell-Flack M, Sidhu I, Zhou F, Vaeth M, Thomas PG, Saunders SP, Stauderman K, Curotto de Lafaille MA, Feske S. Wang YH, et al. Sci Adv. 2022 Oct 7;8(40):eabn6552. doi: 10.1126/sciadv.abn6552. Epub 2022 Oct 7. Sci Adv. 2022. PMID: 36206339 Free PMC article. - CD4+ T-cell subsets in inflammatory diseases: beyond the Th1/Th2 paradigm.
Hirahara K, Nakayama T. Hirahara K, et al. Int Immunol. 2016 Apr;28(4):163-71. doi: 10.1093/intimm/dxw006. Epub 2016 Feb 12. Int Immunol. 2016. PMID: 26874355 Free PMC article. Review. - Single-cell transcriptomic analysis of allergen-specific T cells in allergy and asthma.
Seumois G, Ramírez-Suástegui C, Schmiedel BJ, Liang S, Peters B, Sette A, Vijayanand P. Seumois G, et al. Sci Immunol. 2020 Jun 12;5(48):eaba6087. doi: 10.1126/sciimmunol.aba6087. Sci Immunol. 2020. PMID: 32532832 Free PMC article. - Distinct spatial and temporal roles for Th1, Th2, and Th17 cells in asthma.
Luo W, Hu J, Xu W, Dong J. Luo W, et al. Front Immunol. 2022 Aug 12;13:974066. doi: 10.3389/fimmu.2022.974066. eCollection 2022. Front Immunol. 2022. PMID: 36032162 Free PMC article. Review. - Cell-by-cell deciphering of T cells in allergic inflammation.
Wen T, Rothenberg ME. Wen T, et al. J Allergy Clin Immunol. 2019 Nov;144(5):1143-1148. doi: 10.1016/j.jaci.2019.10.001. J Allergy Clin Immunol. 2019. PMID: 31703761 Free PMC article. Review.
References
- Mosmann TR, Cherwinski H, Bond MW, Giedlin MA, Coffman RL. Two types of murine helper T cell clone. I. Definition according to profiles of lymphokine activities and secreted proteins. J Immunol. 1986;136:2348–2357. - PubMed
- Sallusto F, Lanzavecchia A. Heterogeneity of CD4+ memory T cells: functional modules for tailored immunity. Eur J Immunol. 2009;39:2076–2082. - PubMed
Publication types
MeSH terms
Substances
LinkOut - more resources
Full Text Sources
Research Materials


