Comparison of solution-based exome capture methods for next generation sequencing - PubMed (original) (raw)
Comparative Study
doi: 10.1186/gb-2011-12-9-r94.
Pekka Ellonen, Henrikki Almusa, Maija Lepistö, Samuli Eldfors, Sari Hannula, Timo Miettinen, Henna Tyynismaa, Perttu Salo, Caroline Heckman, Heikki Joensuu, Taneli Raivio, Anu Suomalainen, Janna Saarela
Affiliations
- PMID: 21955854
- PMCID: PMC3308057
- DOI: 10.1186/gb-2011-12-9-r94
Comparative Study
Comparison of solution-based exome capture methods for next generation sequencing
Anna-Maija Sulonen et al. Genome Biol. 2011.
Abstract
Background: Techniques enabling targeted re-sequencing of the protein coding sequences of the human genome on next generation sequencing instruments are of great interest. We conducted a systematic comparison of the solution-based exome capture kits provided by Agilent and Roche NimbleGen. A control DNA sample was captured with all four capture methods and prepared for Illumina GAII sequencing. Sequence data from additional samples prepared with the same protocols were also used in the comparison.
Results: We developed a bioinformatics pipeline for quality control, short read alignment, variant identification and annotation of the sequence data. In our analysis, a larger percentage of the high quality reads from the NimbleGen captures than from the Agilent captures aligned to the capture target regions. High GC content of the target sequence was associated with poor capture success in all exome enrichment methods. Comparison of mean allele balances for heterozygous variants indicated a tendency to have more reference bases than variant bases in the heterozygous variant positions within the target regions in all methods. There was virtually no difference in the genotype concordance compared to genotypes derived from SNP arrays. A minimum of 11× coverage was required to make a heterozygote genotype call with 99% accuracy when compared to common SNPs on genome-wide association arrays.
Conclusions: Libraries captured with NimbleGen kits aligned more accurately to the target regions. The updated NimbleGen kit most efficiently covered the exome with a minimum coverage of 20×, yet none of the kits captured all the Consensus Coding Sequence annotated exons.
Figures
Figure 1
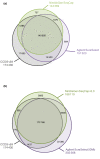
Comparison of the probe designs of the exome capture kits against CCDS exon annotations. (a, b) Given are the numbers of CCDS exon regions, common target regions outside CCDS annotations and the regions covered individually by the Agilent SureSelect and NimbleGen SeqCap sequence capture kits (a) and the Agilent SureSelect 50 Mb and NimbleGen SeqCap v2.0 sequence capture kits (b). Regions of interest are defined as merged genomic positions regardless of their strandedness, which overlap with the kit in question. Sizes of the spheres are proportional to the number of targeted regions in the kit. Total numbers of targeted regions are given under the name of each sphere.
Figure 2
Overview of the variant calling pipeline. VCP consists of sequence analysis software and in-house built algorithms, and its output gives a wide variety of sequencing results. Sequence reads are first filtered for quality. Sequence alignment is then performed with BWA, followed by duplicate removal, variant calling with SAMtools' pileup and in-house developed algorithms for SNV calling with qualities and REA calling. File transformation programs are used to convert different file formats between the software. White boxes, files and intermediate data; purple boxes, filtering steps; grey ellipses, software and algorithms; green boxes, final VCP output; yellow boxes, files for data visualization; area circled with blue dashed line, VCP analysis options not used in this study. PE, paired end.
Figure 3
Number of fully covered CCDS transcripts with different minimum coverage thresholds. For each exon, median coverage was calculated as the sum of sequencing coverage on every nucleotide in the exon divided by the length of the exon. If all the annotated exons of a transcript had a median coverage above a given threshold, the transcript was considered to be completely covered. The number of all CCDS transcripts is 23,634.
Figure 4
Number of identified novel and known single nucleotide variants. SNVs were called with SamTools pileup, and the called variants were filtered based on the allele quality ratio in VCP. Numbers are given for variants with a minimum sequencing depth of 20× in the capture target region (CTR) and CCDS annotated exon regions (CCDS) for the control I sample. Mean numbers for the variants found in the CTRs of the additional samples are also given (CTR Mean). Dark grey bars represent Agilent SureSelect (left panel) and SureSelect 50 Mb (right panel); black bars represent NimbleGen SeqCap (left panel) and SeqCap v2.0 (right panel); light grey bars represent novel SNPs (according to dbSNP b130).
Figure 5
Sharing of single nucleotide variants between the exome capture kits. The number of all sequenced variants in the common target region was specified as the combination of all variants found with a minimum coverage of 20× in any of the exome capture kits (altogether, 15,044 variants). Variable positions were then examined for sharing between all kits, both Agilent kits, both NimbleGen kits, Agilent SureSelect kit and NimbleGen SeqCap kit, and Agilent SureSelect 50 Mb kit and NimbleGen SeqCap v2.0 kit. Numbers for the shared variants between the kits in question are given, followed by the number of shared variants with the same genotype calls. The diagram is schematic, as the sharing between Agilent SureSelect and NimbleGen SeqCap v2.0, Agilent SureSelect 50 Mb and NimbleGen SeqCap or any of the combinations of three exome capture kits is not illustrated.
Figure 6
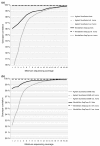
Correlation of sequenced genotypes to the SNP chip genotypes. SAMtools' pileup genotype calls recalled with quality ratios in the VCP were compared with the Illumina Human660W-Quad v1 SNP chip genotypes. (a) The correlations for Agilent SureSelect- and NimbleGen SeqCap-captured sequenced genotypes. (b) The correlations for SureSelect 50 Mb- and SeqCap v2.0-captured sequenced genotypes. Correlations for heterozygous, reference homozygous and variant homozygous SNPs (according to the chip genotype call) are presented on separate lines, though the lines for homozygous variants, laying near 100% correlation, cannot be visualized. The x-axis represents the accumulative minimum coverage of the sequenced SNPs.
Similar articles
- Comprehensive comparison of three commercial human whole-exome capture platforms.
Asan, Xu Y, Jiang H, Tyler-Smith C, Xue Y, Jiang T, Wang J, Wu M, Liu X, Tian G, Wang J, Wang J, Yang H, Zhang X. Asan, et al. Genome Biol. 2011 Sep 28;12(9):R95. doi: 10.1186/gb-2011-12-9-r95. Genome Biol. 2011. PMID: 21955857 Free PMC article. - A comparative analysis of exome capture.
Parla JS, Iossifov I, Grabill I, Spector MS, Kramer M, McCombie WR. Parla JS, et al. Genome Biol. 2011 Sep 29;12(9):R97. doi: 10.1186/gb-2011-12-9-r97. Genome Biol. 2011. PMID: 21958622 Free PMC article. - New insights into the performance of human whole-exome capture platforms.
Meienberg J, Zerjavic K, Keller I, Okoniewski M, Patrignani A, Ludin K, Xu Z, Steinmann B, Carrel T, Röthlisberger B, Schlapbach R, Bruggmann R, Matyas G. Meienberg J, et al. Nucleic Acids Res. 2015 Jun 23;43(11):e76. doi: 10.1093/nar/gkv216. Epub 2015 Mar 27. Nucleic Acids Res. 2015. PMID: 25820422 Free PMC article. - Computational and statistical approaches to analyzing variants identified by exome sequencing.
Stitziel NO, Kiezun A, Sunyaev S. Stitziel NO, et al. Genome Biol. 2011 Sep 14;12(9):227. doi: 10.1186/gb-2011-12-9-227. Genome Biol. 2011. PMID: 21920052 Free PMC article. Review. - Bioinformatics approaches for genomics and post genomics applications of next-generation sequencing.
Horner DS, Pavesi G, Castrignanò T, De Meo PD, Liuni S, Sammeth M, Picardi E, Pesole G. Horner DS, et al. Brief Bioinform. 2010 Mar;11(2):181-97. doi: 10.1093/bib/bbp046. Epub 2009 Oct 27. Brief Bioinform. 2010. PMID: 19864250 Review.
Cited by
- IROme, a new high-throughput molecular tool for the diagnosis of inherited retinal dystrophies.
Schorderet DF, Iouranova A, Favez T, Tiab L, Escher P. Schorderet DF, et al. Biomed Res Int. 2013;2013:198089. doi: 10.1155/2013/198089. Epub 2012 Dec 26. Biomed Res Int. 2013. PMID: 23484092 Free PMC article. Clinical Trial. - Whole-exome sequencing capture kit biases yield false negative mutation calls in TCGA cohorts.
Wang VG, Kim H, Chuang JH. Wang VG, et al. PLoS One. 2018 Oct 3;13(10):e0204912. doi: 10.1371/journal.pone.0204912. eCollection 2018. PLoS One. 2018. PMID: 30281678 Free PMC article. - Detection and identification of transgenic events by next generation sequencing combined with enrichment technologies.
Debode F, Hulin J, Charloteaux B, Coppieters W, Hanikenne M, Karim L, Berben G. Debode F, et al. Sci Rep. 2019 Oct 30;9(1):15595. doi: 10.1038/s41598-019-51668-x. Sci Rep. 2019. PMID: 31666537 Free PMC article. - Genomic tools in acute myeloid leukemia: From the bench to the bedside.
White BS, DiPersio JF. White BS, et al. Cancer. 2014 Apr 15;120(8):1134-44. doi: 10.1002/cncr.28552. Epub 2014 Jan 28. Cancer. 2014. PMID: 24474533 Free PMC article. Review. - Hybridization Capture Using RAD Probes (hyRAD), a New Tool for Performing Genomic Analyses on Collection Specimens.
Suchan T, Pitteloud C, Gerasimova NS, Kostikova A, Schmid S, Arrigo N, Pajkovic M, Ronikier M, Alvarez N. Suchan T, et al. PLoS One. 2016 Mar 21;11(3):e0151651. doi: 10.1371/journal.pone.0151651. eCollection 2016. PLoS One. 2016. PMID: 26999359 Free PMC article.
References
Publication types
MeSH terms
Substances
LinkOut - more resources
Full Text Sources
Other Literature Sources
Miscellaneous


