Dopamine and α-synuclein dysfunction in Smad3 null mice - PubMed (original) (raw)
Dopamine and α-synuclein dysfunction in Smad3 null mice
Silvia Tapia-González et al. Mol Neurodegener. 2011.
Abstract
Background: Parkinson's disease (PD) is characterized by dopaminergic neurodegeneration in the substantia nigra (SN). Transforming growth factor-β1 (TGF-β1) levels increase in patients with PD, although the effects of this increment remain unclear. We have examined the mesostriatal system in adult mice deficient in Smad3, a molecule involved in the intracellular TGF-β1 signalling cascade.
Results: Striatal monoamine oxidase (MAO)-mediated dopamine (DA) catabolism to 3,4-dihydroxyphenylacetic acid (DOPAC) is strongly increased, promoting oxidative stress that is reflected by an increase in glutathione levels. Fewer astrocytes are detected in the ventral midbrain (VM) and striatal matrix, suggesting decreased trophic support to dopaminergic neurons. The SN of these mice has dopaminergic neuronal degeneration in its rostral portion, and the pro-survival Erk1/2 signalling is diminished in nigra dopaminergic neurons, not associated with alterations to p-JNK or p-p38. Furthermore, inclusions of α-synuclein are evident in selected brain areas, both in the perikaryon (SN and paralemniscal nucleus) or neurites (motor and cingulate cortices, striatum and spinal cord). Interestingly, these α-synuclein deposits are detected with ubiquitin and P(S129)-α-synuclein in a core/halo cellular distribution, which resemble those observed in human Lewy bodies (LB).
Conclusions: Smad3 deficiency promotes strong catabolism of DA in the striatum (ST), decrease trophic and astrocytic support to dopaminergic neurons and may induce α-synuclein aggregation, which may be related to early parkinsonism. These data underline a role for Smad3 in α-synuclein and DA homeostasis, and suggest that modulatory molecules of this signalling pathway should be evaluated as possible neuroprotective agents.
Figures
Figure 1
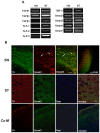
Smad3 is expressed in dopaminergic neurons of the SN. (A) Expression of TGFβ ligands, receptors and Smad3 signalling molecules in the VM and ST of adult mice. RT-PCR from three adult mice are shown under basal conditions for the expression of TGF-β1, -β2, and -β3 ligands, ALK1, ALK2, ALK5 type I receptors, TβR-II type II receptor, Smad2 and Smad3 receptor activated Smads, the common Smad4, and the inhibitory Smad7. Every PCR reaction was performed using 1 μl of the cDNA pool, except for TGF-β3 and ALK1 in the VM where 1, 2 and 3 μl were tested. (B) Coronal sections were double immunostained for TH and Smad3. SN dopaminergic neurons express Smad3 in the cytoplasm, although some neurons have Smad3 in the nucleus (arrows). Quantitative estimate of the values representing colocalized pixels in the dual-color image shows the co-localization of both signals in the SN (Pearson correlation coefficient = 0.62). Confocal images of TH/Smad3 double-labelling in the ST and the motor cortex (Cx-M) suggested region co-localization, but not at the cellular level. Scale bar 50 μm.
Figure 2
Degeneration of dopaminergic neurons in the rostral SN of Smad3 null mice. (A) Quantification of TH-ir neurons was determined using unbiased stereological methods in the midbrain A9, A10 and A8 dopaminergic areas (which include the SN, ventral tegmental area and retrorubral field, respectively). No clear differences were observed between mice when the entire pool of TH-ir cells was counted in these areas. The stereological counting method had a CE < 0.07 for each mouse. (B-C) Representation of the SN (A9) along the rostro-caudal axis showed that Smad3-/- mutant mice had fewer TH-ir neurons than Smad3+/+ in the initial rostral 500 μm of the SN (*P < 0.05, **P < 0.01, Mann-Whitney Rank Sum test). Similar values were detected between mice in the middle and caudal regions. Unpaired _t_-test, n = 5 for Smad3+/+ and n = 6 for Smad3-/- mice. (D) Unbiased stereological quantification of Nissl(+) neurons in the ST of Smad3+/+ and Smad3-/- mice (Unpaired _t_-test, n = 4 mice per genotype). CE ≤ 0.05. (E) Quantification of TH-ir neurons in the rostral portion of the midbrain at perinatal stage (P0). Similar values were found between Smad3+/+ and Smad3-/- mice, indicating no developmental defect, but a postnatal degenerative process in Smad3 deficiency (Student's _t_-test, n = 3-4 per genotype). (F) Confocal microscopic images of Smad3/TH double-labelled neurons in the SN of Smad3+/+ and Smad3-/- mice. In control tissues, some neurons show Smad3 translocated to the nucleus (arrow). Smad3 null mutant mice have no expression of the protein.
Figure 3
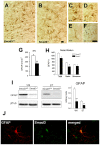
Smad3-/- mice have fewer nigrostriatal astrocytes. In the SN the number of GFAP-ir astrocytes decreased in Smad3 deficiency (A-B, G). Illustrations depict non-activated astrocytes as verified by the labelling of thin, elongated processes in the wild-type (C) and null (D) mice. In the ST, atrophic astrocytes could be detected in Smad3 -/- null mice (F, arrow) when compared to Smad3+/+ mice (E). (H) Number of GFAP-ir cells in the striatal matrix and striosomes. The figure represents the GFAP-ir cells per mm2 in one striatal hemisphere. (I) The GFAP protein content is decreased in both the VM and ST of Smad3 null mice (Student's _t_-test, n = 4-6 per genotype) (J) Confocal images of Smad3 and GFAP double-labelled cells in the SN of wild-type mice showed co-localization of Smad3 in astrocytes. *P < 0.05, **P < 0.01, ***P < 0.001
Figure 4
Smad3 ablation induces an increase in MAO-mediated DA catabolism in the ST. (A) Loss of Smad3 leads to increased catabolism of striatal DA, with no alterations in total neurotransmitter content. (B) The catabolism of DA in Smad3 deficient mice is primarily MAO-mediated (DOPAC/DA ratio) as compared to COMT (3-MT/DA). (C) The striatal GSH content of Smad3 -/- mice is also higher than in Smad3 +/+ mice. (*P < 0.05, **P < 0.01, ***P < 0.001, Student's _t_-test, n = 6 per genotype)
Figure 5
Smad3 deficiency leads to increased MAO-B levels in the ventral midbrain. (A) Smad3-/- mice had higher MAO-B levels in the VM than Smad3+/+ mice. (B) VMAT-2 protein contents are not altered in Smad3-/- mice. Bars represent values normalized to β-tubulin from 6 mice per group, each measured two to three times. **P < 0.01, Student's t- test.
Figure 6
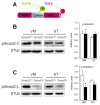
Decreased Smad2 phosphorylation in Smad3 null mice. (A) The MH1 and MH2 domains in Smad2, conserved in other Smads, are connected by a less-conserved linker region. TGF-β and MAPKs signalling induces phosphorylation of certain sites in Smad2. (B) The level of activated Smad2 (carboxy-terminal phosphorylation) is not modified by Smad3 ablation. (C) However, in Smad3 null mice the linker region is less phosphorylated, suggesting a decrease in an intracellular regulatory signal of Smad2 (*P < 0.05, Student's _t_-test, n = 6 per genotype, each measured two to three times).
Figure 7
Decreased Erk1/2 signalling in dopaminergic neurons of Smad3-/- mutants. (A) Analysis of the phosphorylation state of Erk1/2 MAPK in the VM and ST of Smad3 null mice identifies a specific decrease in Erk1/2 activation in the VM (*P < 0.05, Student's _t-_test, n = 6 per genotype, each measured two to three times). (B) Immunolabelling for p-Erk1/2 defines granular cytoplasmic structures in dopaminergic neurons that are fewer when Smad3 is depleted.
Figure 8
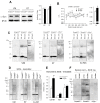
Increased expression and aggregated α-synuclein in Smad3-/- mice. (A) Immunoblots of ST and VM tissue show that Smad3 deficiency increases the striatal α-synuclein content (*P < 0.05, Student's _t_-test with n = 6 mice per genotype, measured in triplicate). (B) Further evaluation of α-synuclein expression by immunohistochemistry along the rostro-caudal axis of the ST. Twenty brain sections per mice were counted from Smad3+/+ (n = 5) and Smad3-/- (n = 6). Figure indicates values for the rostral 1000 μm. O.D. quantification shows an increase in the ST of Smad3 null mice (*P < 0.05, Student's _t_-test). (C-F) Several nervous system regions from Smad3 wild-type and null mice were subjected to graded detergent extraction (Triton-soluble, SDS-soluble, and SDS-insoluble fractions) and analyzed in Western blots. The molecular weight markers on the left indicate the protein size in kilodaltons (**P < 0.01, Student _t-_test, n = 3 for Smad3+/+, n = 5 for Smad3-/-, n = 2 for α-synuclein-/- mice).
Figure 9
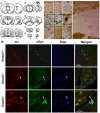
Aggregation of α-synuclein in specific brain areas. (A-G) Rostrocaudal distribution of α-synuclein in Smad3 wild-tupe and deficient mice. Red points represent positive α-synuclein staining in wild-type and null mutant. Blue asterisks illustrate cellular and neuritic aggregates present in old heterozygous and young Smad3 null mice. (H-Q) Photomicrography showing α-synuclein positive structures. (H-J) ST striatum, (K) M1 primary motor cortes, cc corpus callosum in Smad3-/-, (L-N) SN substantia nigra, (O) cp cerebral peduncle, (P) ll lateral lemniscus, and (Q) fa, anterior funiculus of the spinal cord. The double arrows show positive fibres detected in Smad3 deficient mice, asterisks point to synaptic terminals with a punctuate morphology, and the arrowheads indicate perykarial inclusions. (R) Confocal microscopic images of TH/α-synuclein/Dapi triple labelling in the SN of Smad3+/+ and Smad3-/- mice. In control tissues, α-synuclein is present in the cytoplasm of dopaminergic neurons. The aggregates observed in Smad3 deficiency are double-labelled for both molecules (arrow). The window is further magnified to get a better appraisal of the accumulation of α-synuclein in a TH(+) neuron.
Figure 10
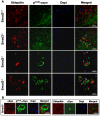
α-synuclein deposits in Smad3 deficiency are ubiquitinated and S129 phosphorylated. (A) Confocal images of aggregates double-labelled with ubiquitin and PS129-α-synuclein in the ventral midbrain of Smad3 deficient mice. Different morphologies could be detected, from a clear core of ubiquitin surrounded by a halo of PS129-α-synuclein (arrows), to strong accumulation of ubiquitin and PS129-α-synuclein in isolated (arrowhead) or groups (double arrowhead) of deposits. (B) α-synuclein staining co-localize with ubiquitin within the core of the aggregates.
Figure 11
Illustration of the working model of pathogenic mechanisms of Smad3 deficient mice, in the cell body (A) and synaptic terminal (B) of mesostriatal dopaminergic neurons.
Similar articles
- AAV1/2-induced overexpression of A53T-α-synuclein in the substantia nigra results in degeneration of the nigrostriatal system with Lewy-like pathology and motor impairment: a new mouse model for Parkinson's disease.
Ip CW, Klaus LC, Karikari AA, Visanji NP, Brotchie JM, Lang AE, Volkmann J, Koprich JB. Ip CW, et al. Acta Neuropathol Commun. 2017 Feb 1;5(1):11. doi: 10.1186/s40478-017-0416-x. Acta Neuropathol Commun. 2017. PMID: 28143577 Free PMC article. - Reprint of: revisiting oxidative stress and mitochondrial dysfunction in the pathogenesis of Parkinson disease-resemblance to the effect of amphetamine drugs of abuse.
Perfeito R, Cunha-Oliveira T, Rego AC. Perfeito R, et al. Free Radic Biol Med. 2013 Sep;62:186-201. doi: 10.1016/j.freeradbiomed.2013.05.042. Epub 2013 Jun 3. Free Radic Biol Med. 2013. PMID: 23743292 Review. - Mutant α-Synuclein Overexpression Induces Stressless Pacemaking in Vagal Motoneurons at Risk in Parkinson's Disease.
Lasser-Katz E, Simchovitz A, Chiu WH, Oertel WH, Sharon R, Soreq H, Roeper J, Goldberg JA. Lasser-Katz E, et al. J Neurosci. 2017 Jan 4;37(1):47-57. doi: 10.1523/JNEUROSCI.1079-16.2016. J Neurosci. 2017. PMID: 28053029 Free PMC article. - Depopulation of dense α-synuclein aggregates is associated with rescue of dopamine neuron dysfunction and death in a new Parkinson's disease model.
Wegrzynowicz M, Bar-On D, Calo' L, Anichtchik O, Iovino M, Xia J, Ryazanov S, Leonov A, Giese A, Dalley JW, Griesinger C, Ashery U, Spillantini MG. Wegrzynowicz M, et al. Acta Neuropathol. 2019 Oct;138(4):575-595. doi: 10.1007/s00401-019-02023-x. Epub 2019 May 31. Acta Neuropathol. 2019. PMID: 31165254 Free PMC article.
Cited by
- Deficiency in Neuronal TGF-β Signaling Leads to Nigrostriatal Degeneration and Activation of TGF-β Signaling Protects against MPTP Neurotoxicity in Mice.
Tesseur I, Nguyen A, Chang B, Li L, Woodling NS, Wyss-Coray T, Luo J. Tesseur I, et al. J Neurosci. 2017 Apr 26;37(17):4584-4592. doi: 10.1523/JNEUROSCI.2952-16.2017. Epub 2017 Mar 31. J Neurosci. 2017. PMID: 28363982 Free PMC article. - How to make striatal projection neurons.
Fjodorova M, Noakes Z, Li M. Fjodorova M, et al. Neurogenesis (Austin). 2015 Dec 15;2(1):e1100227. doi: 10.1080/23262133.2015.1100227. eCollection 2015. Neurogenesis (Austin). 2015. PMID: 27606330 Free PMC article. Review. - KLK6 proteolysis is implicated in the turnover and uptake of extracellular alpha-synuclein species.
Pampalakis G, Sykioti VS, Ximerakis M, Stefanakou-Kalakou I, Melki R, Vekrellis K, Sotiropoulou G. Pampalakis G, et al. Oncotarget. 2017 Feb 28;8(9):14502-14515. doi: 10.18632/oncotarget.13264. Oncotarget. 2017. PMID: 27845893 Free PMC article. - Dopaminergic Neurons and Brain Reward Pathways: From Neurogenesis to Circuit Assembly.
Luo SX, Huang EJ. Luo SX, et al. Am J Pathol. 2016 Mar;186(3):478-88. doi: 10.1016/j.ajpath.2015.09.023. Epub 2015 Dec 24. Am J Pathol. 2016. PMID: 26724386 Free PMC article. Review. - Substantia nigra Smad3 signaling deficiency: relevance to aging and Parkinson's disease and roles of microglia, proinflammatory factors, and MAPK.
Liu Y, Yu L, Xu Y, Tang X, Wang X. Liu Y, et al. J Neuroinflammation. 2020 Nov 16;17(1):342. doi: 10.1186/s12974-020-02023-9. J Neuroinflammation. 2020. PMID: 33198771 Free PMC article.
References
Publication types
MeSH terms
Substances
LinkOut - more resources
Full Text Sources
Research Materials
Miscellaneous
