Dynamin 2 mediates PDGFRα-SHP-2-promoted glioblastoma growth and invasion - PubMed (original) (raw)
Dynamin 2 mediates PDGFRα-SHP-2-promoted glioblastoma growth and invasion
H Feng et al. Oncogene. 2012.
Abstract
Dynamin 2 (Dyn2), a large GTPase, is involved in receptor tyrosine kinase (RTK)-promoted cell migration. However, the molecular mechanisms by which Dyn2 regulates RTK-induced cell migration have not been established. Recently, we reported that tyrosine-protein phosphatase non-receptor type 11 (SHP-2) and phosphatidylinositol 3-kinase (PI3K) mediate platelet-derived growth factor receptor-α (PDGFRα)-promoted glioma tumor growth and invasion. Here, we show that Dyn2 is an effector downstream of the PDGFRα-PI3K/SHP-2 signaling in glioma cells. Depletion of endogenous Dyn2 by short hairpin RNAs (shRNAs) inhibited PDGFRα-stimulated phosphorylation of Akt, Erk1/2, Rac1 and Cdc42 activities, glioma cell migration and survival in vitro and tumor growth and invasion in the brains of mice. Dyn2 binds to SHP-2 and PI3K and colocalizes with PDGFRα at the invasive fronts in PDGF-A-stimulated glioma cells. Inhibition of SHP-2 by siRNA knockdown abrogated Dyn2 association with activated PDGFRα and PDGFRα activation of Rac1 and Cdc42, and glioma cell migration, thereby establishing a link between SHP-2 interaction with Dyn2 and the PDGFRα signaling. Furthermore, a dominant-negative SHP-2 C459S mutant inhibited PDGF-A-stimulated glioma cell migration, phosphorylation of Dyn2 and concomitantly blocked PDGFRα-induced Src activation. Inhibition of Src by Src inhibitors attenuated PDGF-A-stimulated phosphorylation of Akt and Dyn2 and glioma cell migration. Additionally, mutations of binding sites to PI3K, SHP-2 or Src of PDGFRα impaired PDGFRα-stimulated phosphorylation of Akt and Dyn2, and Dyn2 association with activated PDGFRα. Taken together, this study identifies Dyn2 as an effector that mediates PDGFRα-SHP-2-induced glioma tumor growth and invasion, suggesting that targeting the PDGFRα-SHP-2-Dyn2 pathway may be beneficial to patients with malignant glioblastomas.
Figures
Figure 1
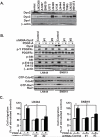
Knockdown of Dyn2 inhibits PDGFRα-promoted glioma cell migration in vitro A. IB assays of expression of Dyn2, Dyn3 and Dyn1 in various glioma cells, mouse astrocytes (mAst) and fibroblast (NIH3T3) cells. β-actin was used as loading controls. B. IB assays. Knockdown of Dyn2 by shRNAs inhibits PDGFRα stimulation of protein phosphorylation of Akt and Erk1/2, activities of Cdc42 and Rac1 in PDGF-A-stimulated LN444 and SNB19 glioma cells. A GFP shRNA was used as a control. Akt, Erk1/2, Cdc42, Rac1, β-actin and PDGFRα were used as loading controls. C. In vitro cell migration assays using cells generated from (B). Fifty ng/ml PDGF-A was included in lower wells of a Boyden Chamber to induce cell migration for 8–10 h. Data is presented as a percentage of migrated cells normalized to the stimulated control (100%) from six replicates per pair per cell line; Bars, SD. *, P < 0.05, one-way ANOVA followed by Newman-Keuls post hoc test. Results in A to C represent three independent experiments with similar results.
Figure 2
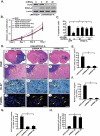
Knockdown of Dyn2 inhibits PDGFRα-promoted glioma tumor growth and invasion in the brains of mice A. IB assays. Knockdown of endogenous Dyn2 by shRNAs in puromycin-selected LN444/PDGF-A glioma cell populations. C, control GFP shRNA; #1 and #2, Dyn2 shRNAs that target different sequences of Dyn2 mRNA. PDGF-A, exogenously expressed PDGF-A. β-actin was used as loading control. B. In vitro MTT assays. 4,000 cells of various cells with similar passages were seeded in one well of 96-well plates with DMEM plus 0.5% FBS containing AG1296 (AG, 2 μM) or vehicle at indicated times. Six replicates per cell line. Cell proliferation was determined by MTT assays. The data was normalized to the mean MTT values of the untreated cells at Day 0 (assigned as 1) for each type of cells. Bars, SD. C. TUNEL assays. Various cells with similar passages were seeded in 8-well chamber slides with DMEM plus 0.5% FBS containing 2 μM AG1296 or vehicle. After 48 h of the treatment, cell apoptosis was determined by TUNEL assays. One thousand cells of each slide were randomly examined and numbers of TUNEL-positive cells were counted. Bars, SD. *, P < 0.05, one-way ANOVA followed by Newman-Keuls post hoc test. D. Impact of Dyn2 knockdown on PDGFRα-promoted LN444 glioma growth, invasion, cell proliferation and apoptosis in vivo. Representative H&E and IHC images of brain sections of 3 to 5 mice per group from two independent experiments. Mice received various LN444 glioma cells and developed brain tumors in various sizes 7 to 8 weeks post injection. Panels a, d, g and j, LN444/PDGF-A tumors expressed a control shRNA; b, e, h and k, LN444/PDGF-A/Dyn2 shRNA #1; c, f, i and l, LN444/PDGF-A/Dyn2 shRNA #2. H&E staining, panels a to f. Panels d to f are enlarged areas in a to c marked with squares. Panels g to i, Ki-67 staining. Panels j to l, TUNEL staining; arrows in d to f, invasive tumor cells (d) or non-invasive tumor boarders (e and f), in g to i, Ki-67 positive cells and in j to l, TUNEL positive cells. Scale bars in a to c, 1 mm, in d to f, 200 μm, in g to i, 50 μm and in j to l, 100 μm. E and F. Quantifications of tumor size and relative invasive fingers per tumor. E. Tumor volumes were determined by microscopically measuring tumor areas followed by estimation of the tumor volume as an oval sphere-shape. All mice received various LN444/PDGF-A/shControl or LN444/PDGF-A/shRNA-Dyn2 cells developed brain gliomas with volumes varied but within acceptable standard deviations. F. Relative invasive figures were estimated microscopically by counting protruded tumor tissue figures and disseminated areas as shown in panel a and d. Data in E and F are calculated from 3 to 5 tumors per group. Bars, SD. *, P < 0.05, one-way ANOVA followed by Newman-Keuls post hoc test. G and H. Quantifications of Ki-67 or TUNEL staining. Data is calculated from 3 to 5 tumors per group from two independent experiments. Bars, SD. *, P < 0.05, one-way ANOVA followed by Newman-Keuls post hoc test. Results in A to H represent two to three independent experiments with similar results.
Figure 3
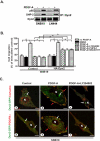
Dyn2 mediates PDGF-A-stimulated glioma cell migration through PI3K and SHP-2 A. IP and IB assays of endogenous Dyn2 binding with PI3K and SHP-2. Dyn2 was used as a control. B. Overexpression of HA-Dyn2 partially rescued the inhibitory effect of PI3K and SHP-2 inhibitors on PDGFRα-promoted glioma cell migration. Cells generated from (A) were serum-starved for 24 h, and then pre-treated with or without LY294002 (10 μM), PHPS-1 (100 μM), NSC87877 (100 μM) for 1 h on ice and analyzed by in vitro cell migration assays for 8 to 10 h as described in Figure 1C. Data is presented as a percentage of migrated cells normalized to the stimulated control (100%) from six replicates per pair per cell line. Bars, SD. *, P < 0.05, one-way ANOVA followed by Newman-Keuls post hoc test. C. PDGF-A induced and a PI3K inhibitor inhibited co-localization of Dyn2 and cortactin, and Dyn2 and PDGFRα at the invasion fronts of SNB19 cells. Representative confocal microscopic images of immunofluorescent staining are shown. Individual images are shown in Figure S5. Serum-starved SNB19 cells transiently transfected with a WT Dyn2-GFP were pre-treated with 10 μM LY294002 for 1 h followed by 5 min stimulation with 50 ng/ml PDGF-A. Cells were then separately stained with anti-cortactin or anti-PDGFRα antibodies followed by secondary antibodies conjugated with different fluorophores (scale bar, 15 μm). N, nuclear; red arrows, co-localization of Dyn2 and cortactin or Dyn2 and PDGFRα at the invasion fronts; white arrows, Dyn2-GFP localized to the pericantriolar material and centrioles. Results in A to C represent two to three independent experiments with similar results.
Figure 4
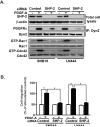
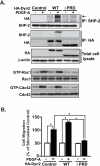
SHP-2 mediates PDGF-A-stimulated Dyn2 association with PDGFRα, cell migration A. Knockdown of SHP-2 inhibited PDGF-A-induced Dyn2 association with PDGFRα and PDGF-A activation of Rac1 and Cdc42. SNB19 and LN444 glioma cells were transiently transfected with a SHP-2 siRNA, or a control siRNA. Forth-eight h after transfection, cells were stimulated with 50 ng/ml PDGF-A for 5 min and analyzed by IP-IB for Dyn2 association with PDGFRα or Rac1 and Cdc42 activities. b-actin, SHP-2, Rac1 and Cdc42 were used as loading controls. B. Knockdown of SHP-2 inhibited PDGF-A-stimulated cell migration. In vitro cell migration assays were performed for 8 to 10 h as described in Figure 1C using cells generated in (A). Data is presented as a percentage of migrated cells normalized to the stimulated control (100%) from six replicates per pair per cell line. Bars, SD. *, P < 0.05, one-way ANOVA followed by Newman-Keuls post hoc test. Results in A and B represent two to three independent experiments with similar results.
Figure 5
PRD domain of Dyn2 mediates PDGF-A-induced Dyn2 association with SHP-2, and Rac1 and Cdc42 activation A. IP and IB assays. SNB19 glioma cells were transiently transfected with WT HA-Dyn2, HA-Dyn2-ΔPRD mutant or a vector control, respectively. Forty-eight h after transfection, cells were stimulated with 50 ng/ml PDGF-A for 5 min. Impact of Dyn2 ΔPRD mutant on Dyn2 association with SHP-2 (upper panels) and Rac1 and Cdc42 activation (lower panels) were determined by IP-IB analyses. β-actin, SHP-2, HA-Dyn2 WT, HA-Dyn2-ΔPRD, Rac1 and Cdc42 were used as loading controls. Arrow, HA-Dyn2 WT. B. In vitro cell migration assays using cells generated from (A). Data is presented as a percentage of migrated cells normalized to the stimulated control (100%) from six replicates per pair per cell line. Bars, SD. *, P < 0.05, one-way ANOVA followed by Newman-Keuls post hoc test. Results in A and B represent two to three independent experiments with similar results.
Figure 6
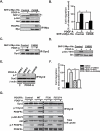
SHP-2 regulates Src-dependent tyrosine phosphorylation of Dyn2 in PDGF-A-stimulated glioma cells A. IB and IP assays. Expression of a DN C459S SHP-2 (catalytically-inactive) mutant inhibited PDGF-A-induced p-Akt but did not impair SHP-2 association with activated PDGFRα in SNB19 glioma cells. Akt and Myc were used as loading controls. Arrow, exogenously expressed a Myc-His tagged DN C459S SHP-2; dash arrow, endogenous SHP-2. B. In vitro cell migration assays of the impact of expression of the DN C459S SHP-2 mutant on PDGFRα-induced glioma cell migration. Data is presented as a percentage of migrated cells normalized to the stimulated control (100%) from six replicates per pair per cell line. C and D. IP and IB assays. Expression of the DN SHP-2 C459S mutant inhibited PDGF-A-induced p-Y of Dyn2 and p-SrcY418 in SNB19 glioma cells. Dyn2 and Src were used as loading controls. E. IP and IB assays. Src family kinase (SFK) inhibitors PP2 and SU6656 attenuated PDGF-A-induced p-Y of Dyn2 in SNB19 glioma cells. Serum-starved SNB19 cells were pretreated with or without 2 μM PP2 or 2 μM SU6656 for 2 h and stimulated with or without 50 ng/ml PDGF-A for 5 min followed by IP-IB assays. Dyn2 and β-actin were used as loading controls. F. In vitro cell migration assays of the impact of SFK inhibitors on PDGF-A-stimulated glioma cell migration. Data is presented as a percentage of migrated cells normalized to the stimulated control (100%) from six replicates per pair per cell line. G. IB and IP assays. Effect of expression of PDGFRα WT or mutants on p-Y of Dyn2, Dyn2 association with PDGFRα, and p-Akt in mouse Ink4a/Arf null arstrocytes. Control, vector only; WT, PDGFRα wild type; F720, PDGFRα with a mutation at the SHP-2 binding site; F572/74, PDGFRα with mutations at the Src binding sites. Total Akt and PDGFRα were used as loading controls. Bars in panels B and F, SD. *, P < 0.05, one-way ANOVA followed by Newman-Keuls post hoc test. Results in A to G represent two to three independent experiments with similar results.
Figure 7
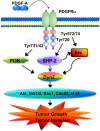
A working model for the PDGFRα-PI3K/SHP2-Dyn2 signaling in glioma cells. PDGF-A activation of PDGFRα induces Dyn2 association with PI3K and SHP-2 and activates SHP-2 and Src, leading to Src-dependent tyrosine phosphorylation of Dyn2. Activation of Dyn2 stimulates its downstream effectors including Akt, Erk1/2, Rac1 and Cdc42, resulting in increased glioma growth and invasion.
Similar articles
- SHP-2-upregulated ZEB1 is important for PDGFRα-driven glioma epithelial-mesenchymal transition and invasion in mice and humans.
Zhang L, Zhang W, Li Y, Alvarez A, Li Z, Wang Y, Song L, Lv D, Nakano I, Hu B, Cheng SY, Feng H. Zhang L, et al. Oncogene. 2016 Oct 27;35(43):5641-5652. doi: 10.1038/onc.2016.100. Epub 2016 Apr 4. Oncogene. 2016. PMID: 27041571 Free PMC article. - SHP-2/PTPN11 mediates gliomagenesis driven by PDGFRA and INK4A/ARF aberrations in mice and humans.
Liu KW, Feng H, Bachoo R, Kazlauskas A, Smith EM, Symes K, Hamilton RL, Nagane M, Nishikawa R, Hu B, Cheng SY. Liu KW, et al. J Clin Invest. 2011 Mar;121(3):905-17. doi: 10.1172/JCI43690. J Clin Invest. 2011. PMID: 21393858 Free PMC article. - Activation of Rac1 by Src-dependent phosphorylation of Dock180(Y1811) mediates PDGFRα-stimulated glioma tumorigenesis in mice and humans.
Feng H, Hu B, Liu KW, Li Y, Lu X, Cheng T, Yiin JJ, Lu S, Keezer S, Fenton T, Furnari FB, Hamilton RL, Vuori K, Sarkaria JN, Nagane M, Nishikawa R, Cavenee WK, Cheng SY. Feng H, et al. J Clin Invest. 2011 Dec;121(12):4670-84. doi: 10.1172/JCI58559. Epub 2011 Nov 14. J Clin Invest. 2011. PMID: 22080864 Free PMC article. - Platelet-derived growth factor receptor alpha in glioma: a bad seed.
Liu KW, Hu B, Cheng SY. Liu KW, et al. Chin J Cancer. 2011 Sep;30(9):590-602. doi: 10.5732/cjc.011.10236. Chin J Cancer. 2011. PMID: 21880180 Free PMC article. Review. - PDGFRα in liver pathophysiology: emerging roles in development, regeneration, fibrosis, and cancer.
Kikuchi A, Monga SP. Kikuchi A, et al. Gene Expr. 2015;16(3):109-27. doi: 10.3727/105221615X14181438356210. Gene Expr. 2015. PMID: 25700367 Free PMC article. Review.
Cited by
- Spatial regulation of receptor tyrosine kinases in development and cancer.
Casaletto JB, McClatchey AI. Casaletto JB, et al. Nat Rev Cancer. 2012 May 24;12(6):387-400. doi: 10.1038/nrc3277. Nat Rev Cancer. 2012. PMID: 22622641 Free PMC article. Review. - Dynamin2 downregulation delays EGFR endocytic trafficking and promotes EGFR signaling and invasion in hepatocellular carcinoma.
Gong C, Zhang J, Zhang L, Wang Y, Ma H, Wu W, Cui J, Wang Y, Ren Z. Gong C, et al. Am J Cancer Res. 2015 Jan 15;5(2):702-13. eCollection 2015. Am J Cancer Res. 2015. PMID: 25973308 Free PMC article. - A critical role for PDGFRα signaling in medial nasal process development.
He F, Soriano P. He F, et al. PLoS Genet. 2013;9(9):e1003851. doi: 10.1371/journal.pgen.1003851. Epub 2013 Sep 26. PLoS Genet. 2013. PMID: 24086166 Free PMC article. - CUEDC2 suppresses glioma tumorigenicity by inhibiting the activation of STAT3 and NF-κB signaling pathway.
Li F, Tang C, Jin D, Guan L, Wu Y, Liu X, Wu X, Wu QY, Gao D. Li F, et al. Int J Oncol. 2017 Jul;51(1):115-127. doi: 10.3892/ijo.2017.4009. Epub 2017 May 17. Int J Oncol. 2017. PMID: 28534933 Free PMC article. - SHP-2-Mediated Upregulation of ZEB1 Is Important for PDGF-B-Induced Cell Proliferation and Metastatic Phenotype in Triple Negative Breast Cancer.
Zhang L, Yuan C, Peng J, Zhou L, Jiang Y, Lin Y, Yin W, Xu S, Ma J, Lu J. Zhang L, et al. Front Oncol. 2020 Aug 6;10:1230. doi: 10.3389/fonc.2020.01230. eCollection 2020. Front Oncol. 2020. PMID: 32850368 Free PMC article.
References
- Boyle SN, Michaud GA, Schweitzer B, Predki PF, Koleske AJ. A critical role for cortactin phosphorylation by Abl-family kinases in PDGF-induced dorsal-wave formation. Curr Biol. 2007;17:445–51. - PubMed
Publication types
MeSH terms
Substances
Grants and funding
- R01 CA130966-04/CA/NCI NIH HHS/United States
- UL1 TR000005/TR/NCATS NIH HHS/United States
- UL1 RR024153/RR/NCRR NIH HHS/United States
- R01 CA130966/CA/NCI NIH HHS/United States
- R01 CA130966-03/CA/NCI NIH HHS/United States
- R01 CA104125/CA/NCI NIH HHS/United States
- CA130966/CA/NCI NIH HHS/United States
LinkOut - more resources
Full Text Sources
Molecular Biology Databases
Research Materials
Miscellaneous
