CD49f and CD61 identify Her2/neu-induced mammary tumor-initiating cells that are potentially derived from luminal progenitors and maintained by the integrin-TGFβ signaling - PubMed (original) (raw)
CD49f and CD61 identify Her2/neu-induced mammary tumor-initiating cells that are potentially derived from luminal progenitors and maintained by the integrin-TGFβ signaling
P-K Lo et al. Oncogene. 2012.
Abstract
Human epidermal growth factor receptor 2 (HER2)/Neu is overexpressed in 20-30% of breast cancers and associated with aggressive phenotypes and poor prognosis. For deciphering the role of HER2/Neu in breast cancer, mouse mammary tumor virus (MMTV)-Her2/neu transgenic mice that develop mammary tumors resembling human HER2-subtype breast cancer have been established. Several recent studies have revealed that HER2/Neu is overexpressed in and regulates self renewal of breast tumor-initiating cells (TICs). However, in the MMTV-Her2/neu transgenic mouse model, the identity of TICs remains elusive, despite previous studies showing supportive evidence for existence of TICs in Her2/neu-induced mammary tumors. Through systematic screening and characterization, we identified that surface markers CD49f, CD61 and ESA were aberrantly overexpressed in Her2-overexpressing mammary tumor cells. Analysis of these markers and CD24 detected anomalous expansion of the luminal progenitor population in preneoplastic mammary glands of Her2/neu transgenic mice, indicating that aberrant luminal progenitors originated in Her2-induced mammary tumors. The combined markers, CD49f and CD61, further delineated the CD49f(high)CD61(high)-sorted fraction as a TIC-enriched population, which displayed increased tumorsphere formation ability, enhanced tumorigenicity both in vitro and in vivo and drug resistance to pacitaxel and doxorubicin. Moreover, the TIC-enriched population manifested increased transforming growth factor-β (TGFβ) signaling and exhibited gene expression signatures of stemness, TGFβ signaling and epithelial-to-mesenchymal transition. Our findings that self-renewal and clonogenicity of TICs were suppressed by pharmacologically inhibiting the TGFβ signaling further indicate that the TGFβ pathway is vital for maintenance of the TIC population. Finally, we showed that the integrin-β3 (CD61) signaling pathway was required for sustaining active TGFβ signaling and self-renewal of TICs. We for the first time developed a technique to highly enrich TICs from mammary tumors of Her2/neu transgenic mice, unraveled their properties and identified the cooperative integrin-β3-TGFβ signaling axis as a potential therapeutic target for HER2-induced TICs.
Conflict of interest statement
Conflicts of Interest The authors declare no conflict of interest.
Figures
Figure 1
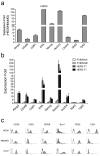
Expression analysis of stem cell marker genes in the tumor cell line derived from primary MMTV-Her2/neu tumor. (a) Quantitative RT-PCR analysis of stem cell marker genes in H6O5 cells vs. NMuMG cells. The mean and SD are calculated from triplicate experiments. (b) Quantitative expression analysis of stem cell marker genes in normal mammary epithelial cells from FVB/N mice as well as in mammary tumor epithelial cells of primary tumors from _Her2/neu_-transgenic mice. Two different cDNA samples each for normal or tumor epithelial cells were analyzed by real-time qRT-PCR assays. The expression folds (mean ± SD) from triplicate experiments are shown. (c) Flow cytometric (FACS) analysis of stem cell surface antigens in H6O5 cells and two immortalized mouse mammary epithelial cell lines, NMuMG and C127. Histograms are shown for displaying distributions of antibody-staining intensities of surface antigens (CD29, CD61, CD49f, Sca1, CD24 and ESA) vs. cell numbers.
Figure 2
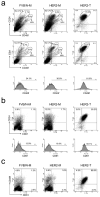
FACS analysis of CD49f, CD24, ESA and CD61 in normal mammary glands, MMTV-Her2/neu preneoplastic mammary glands and tumors. FACS analysis was performed to examine the protein expression of CD49f, CD24, ESA and CD61 on mammary glands of FVB/N mice as well as _Her2/neu_-transgenic mice and on primary mammary tumors arising in MMTV-_Her2/neu_-transgenic mice. CD24 vs. CD49f as well as ESA vs. CD49f, CD24 vs. CD61 and CD49f vs. CD61 are shown in (a), (b) and (c), respectively. Histogram analyses of CD49f and CD61 are shown in the bottom panels of subfigure (a) and (b), respectively. FVB/N-M: control mammary gland; HER2-M: _Her2/neu_-transgenic mouse mammary gland; NER2-T: Her2/neu tumor.
Figure 3
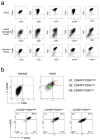
FACS profiling analysis of in vitro and in vivo Her2-overexpressing mammary tumor cells. (a) FACS profiling of CD49f, CD61, CD24 and ESA in in vitro cultured H6O5 cells, in vivo H6O5-derived xenograft tumors and primary Her2-induced mammary tumors. Isolated tumor cells were stained with several different combinations of antibodies against two surface antigens as indicated for two-color FACS analysis. The areas of two-color cell staining patterns in dot plot analysis of H6O5-derived xenograft tumors corresponding to those of primary Her2/neu tumors are circled. (b) FACS analysis of CD24 and ESA in gated CD49fhighCD61high, CD49fhighCD61low and CD49flowCD61low H6O5 cells. H6O5 cells were stained with CD61-FITC, CD49f-PE, CD24-APC and ESA-APC-Cy7 antibodies for four-color FACS analysis. The FACS profile of CD49f and CD61 in NMuMG cells was used to set the quadrant lines for defining high and low intensities of CD49f and CD61 in H6O5 cells.
Figure 4
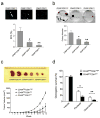
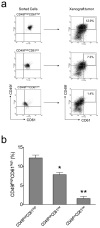
Isolated CD49fhighCD61high cells exhibit features of Tumor-initiating cells. (a) Enhanced tumorsphere formation ability in CD49fhighCD61high cells. Sorted H6O5 cells were cultured in serum-free medium for sphere formation assay. SFE: sphere formation efficiency. (b) Increased clonogenic ability in CD49fhighCD61high cells. 1000 sorted H6O5 cells were seeded for clonogenic analysis. Bar graphs (the bottom panel) shown in (a) and (b) were generated from triplicate experiments. Error bars indicate SD. The symbols (*, **) indicate statistically significant differences (p < 0.05) in sphere (a) or colony (b) numbers of the other two sorted fractions compared to that of the CD49fhighCD61high fraction. (c) CD49fhighCD61high cells showed the early onset of in vivo tumor formation. 5000 sorted H6O5 cells were transplanted into the mammary glands of syngeneic mice. The tumor formation was monitored for 13 weeks, and then mice were sacrificed and dissected. The dissected tumors were photographed and shown in the top panel. (d) CD49fhighCD61high cells manifest drug resistance to pacitaxel and doxorubicin. Sorted H6O5 cells were treated with pacitaxel (2 nM) for 24 h and doxorubicin (25 ng/ml) for 10 h, and then 5000 drug-treated cells each were plated in a 6-cm cell culture dish for clonogenic assays. Two weeks later, cell colonies were stained with crystal violet and colony numbers were counted for determining the percentages of clonogenic survival (drug-treated cells relative to vehicle-treated cells). The mean and SD of each drug-treated cell survival dataset were derived from triplicate experiments. The symbols (*, **) indicate a statistically significant difference (p < 0.05) in clonogenic survival percentages of drug-treated CD49fhighCD61high cells compared to those of drug-treated CD49flowCD61low cells.
Figure 5
Repopulation of CD49fhighCD61high H6O5 cells during the development of xenograft tumors. (a) FACS analysis of CD49f and CD61 was performed on isolated CD49fhighCD61high, CD49fhighCD61low and CD49flowCD61low H6O5 cells as well as their respective xenograft tumors. CD49fhighCD61high cells in xenograft tumors are boxed and their percentage is indicated in the box. (b) FACS data in (a) from triplicate transplantation experiments were plotted as a bar graph with error bars (indicating SD). The symbols (*, **) indicate a statistically significant difference (p < 0.05) in CD49fhighCD61high percentages.
Figure 6
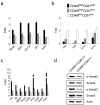
Isolated CD49fhighCD61high cells display the stemness, TGFβ signaling and EMT gene signatures. Quantitative RT-PCR analysis of stem cell (a), differentiation (b) and TGFβ/EMT (c) marker genes were performed on isolated CD49fhighCD61high, CD49fhighCD61low and CD49flowCD61low H6O5 cells. The mean and SD of each gene expression data were derived from triplicate experiments. (d) Enhanced activation of the TGFβ signaling pathway in sorted CD49fhighCD61high cells compared to sorted CD49flowCD61low cells. Western blot analysis of phospho-Smad2 (Ser465/467), total Smad2, phospho-Smad3 (Ser423/425), total Smad3 and Actin was performed on protein lysates derived from sorted CD49fhighCD61high and CD49flowCD61low cells.
Figure 7
Inhibition of the TGFβ-receptor signaling leads to a decrease in TICs (CD49fhighCD61high) cells, downregulation of EMT-programmed genes and abrogation of clonogenic and tumorsphere formation abilities of H6O5 cells. (a) FACS analysis of CD49f and CD61 in TGFβ inhibitor-treated H6O5 cells. CD49fhighCD61high cells were boxed and their percentage is indicated in the box. Results from triplicate experiments were plotted as a bar graph (the bottom panel) (b) Quantitative expression analysis of EMT-programmed genes in TGFβ inhibitor-treated H6O5 cells. Triplicate experiments were performed on H6O5 cells treated with TGFβ inhibitors as described in (a). Microscopic photographs of vehicle- and drug-treated H6O5 cells are shown in the top panel. (c) Tumorsphere formation analysis of TGFβ inhibitor-treated H6O5 cells. Four-day-treated H6O5 cells were seeded for sphere formation assay. Triplicate experiments were performed. (d) Clonogenic analysis of TGFβ inhibitor-treated H6O5 cells. Stained colonies from vehicle- and drug-treated H6O5 cells are shown in the top panel. The bar graph (the bottom panel) was generated from triplicate experiments. Error bars represent SD. The symbols (*, **) shown in (a), (c) and (d) indicate a statistically significant difference (p < 0.05).
Figure 8
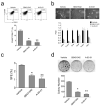
Knockdown of integrin β3 (CD61) leads to a reduction in the TGFβ signaling and suppression of TIC self-renewal. (a) Western blot analysis of integrin β3 and TGFβ signaling pathways in H6O5 cells with CD61 knockdown. H6O5 cells were transfected with control or CD61 siRNA and transfected cells were harvested at 48 h after siRNA transfections for Western blot analysis using antibodies against CD61, phospho-FAK (Tyr397), total FAK, phospho-c-Src (Tyr416), total c-Src, phospho-Smad2 (Ser465/467), total Smad2, phospho-Smad3 (Ser423/425), total Smad3 and Actin. Mouse CD61 siRNA is composed of a pool of 4 different CD61-specific siRNA duplexes (Dharmacon). Untransfected H6O5 cells were also included in the parallel analysis. (b) Tumorsphere formation analysis of CD61-knockdown H6O5 cells. Sphere formation assays were performed on untransfected, control siRNA-transfected and CD61 siRNA-transfected H6O5 cells. The symbol (*) indicates a statistically significant difference (p < 0.05).
Comment in
- Multipotent PI-MECs are the true targets of MMTV-neu tumorigenesis.
Wagner KU, Booth BW, Boulanger CA, Smith GH. Wagner KU, et al. Oncogene. 2013 Mar 7;32(10):1338. doi: 10.1038/onc.2012.452. Epub 2012 Oct 8. Oncogene. 2013. PMID: 23045277 No abstract available.
Similar articles
- Metformin selectively targets tumor-initiating cells in ErbB2-overexpressing breast cancer models.
Zhu P, Davis M, Blackwelder AJ, Bachman N, Liu B, Edgerton S, Williams LL, Thor AD, Yang X. Zhu P, et al. Cancer Prev Res (Phila). 2014 Feb;7(2):199-210. doi: 10.1158/1940-6207.CAPR-13-0181. Epub 2013 Dec 9. Cancer Prev Res (Phila). 2014. PMID: 24322659 Free PMC article. - Identification of tumorsphere- and tumor-initiating cells in HER2/Neu-induced mammary tumors.
Liu JC, Deng T, Lehal RS, Kim J, Zacksenhaus E. Liu JC, et al. Cancer Res. 2007 Sep 15;67(18):8671-81. doi: 10.1158/0008-5472.CAN-07-1486. Cancer Res. 2007. PMID: 17875707 - Expression of Six1 in luminal breast cancers predicts poor prognosis and promotes increases in tumor initiating cells by activation of extracellular signal-regulated kinase and transforming growth factor-beta signaling pathways.
Iwanaga R, Wang CA, Micalizzi DS, Harrell JC, Jedlicka P, Sartorius CA, Kabos P, Farabaugh SM, Bradford AP, Ford HL. Iwanaga R, et al. Breast Cancer Res. 2012 Jul 5;14(4):R100. doi: 10.1186/bcr3219. Breast Cancer Res. 2012. PMID: 22765220 Free PMC article. - When tumor suppressor TGFβ meets the HER2 (ERBB2) oncogene.
Chow A, Arteaga CL, Wang SE. Chow A, et al. J Mammary Gland Biol Neoplasia. 2011 Jun;16(2):81-8. doi: 10.1007/s10911-011-9206-4. Epub 2011 Apr 6. J Mammary Gland Biol Neoplasia. 2011. PMID: 21590373 Free PMC article. Review. - Transforming growth factor-beta signaling: emerging stem cell target in metastatic breast cancer?
Tan AR, Alexe G, Reiss M. Tan AR, et al. Breast Cancer Res Treat. 2009 Jun;115(3):453-95. doi: 10.1007/s10549-008-0184-1. Epub 2008 Oct 9. Breast Cancer Res Treat. 2009. PMID: 18841463 Free PMC article. Review.
Cited by
- Neuregulin autocrine signaling promotes self-renewal of breast tumor-initiating cells by triggering HER2/HER3 activation.
Lee CY, Lin Y, Bratman SV, Feng W, Kuo AH, Scheeren FA, Engreitz JM, Varma S, West RB, Diehn M. Lee CY, et al. Cancer Res. 2014 Jan 1;74(1):341-52. doi: 10.1158/0008-5472.CAN-13-1055. Epub 2013 Oct 31. Cancer Res. 2014. PMID: 24177178 Free PMC article. - Downregulation of Rab27A contributes to metformin-induced suppression of breast cancer stem cells.
Feng F, Zhang J, Fan X, Yuan F, Jiang Y, Lv R, Ma Y. Feng F, et al. Oncol Lett. 2017 Sep;14(3):2947-2953. doi: 10.3892/ol.2017.6542. Epub 2017 Jul 8. Oncol Lett. 2017. PMID: 28928832 Free PMC article. - Regulation of breast cancer oncogenesis by the cell of origin's differentiation state.
Petrova SC, Ahmad I, Nguyen C, Ferrell SD Jr, Wilhelm SR, Ye Y, Barsky SH. Petrova SC, et al. Oncotarget. 2020 Oct 27;11(43):3832-3848. doi: 10.18632/oncotarget.27783. eCollection 2020 Oct 27. Oncotarget. 2020. PMID: 33196707 Free PMC article. - Identification and Pharmacological Targeting of Treatment-Resistant, Stem-like Breast Cancer Cells for Combination Therapy.
Worley J, Noh H, You D, Turunen MM, Ding H, Paull E, Griffin AT, Grunn A, Zhang M, Guillan K, Bush EC, Brosius SJ, Hibshoosh H, Mundi PS, Sims P, Dalerba P, Dela Cruz FS, Kung AL, Califano A. Worley J, et al. bioRxiv [Preprint]. 2025 Feb 12:2023.11.08.562798. doi: 10.1101/2023.11.08.562798. bioRxiv. 2025. PMID: 38798673 Free PMC article. Preprint. - Integrins in cancer stem cells.
Gou S, Wu A, Luo Z. Gou S, et al. Front Cell Dev Biol. 2024 Aug 21;12:1434378. doi: 10.3389/fcell.2024.1434378. eCollection 2024. Front Cell Dev Biol. 2024. PMID: 39239559 Free PMC article. Review.
References
- Asselin-Labat ML, Sutherland KD, Barker H, Thomas R, Shackleton M, Forrest NC, et al. Gata-3 is an essential regulator of mammary-gland morphogenesis and luminal-cell differentiation. Nat Cell Biol. 2007;9:201–209. - PubMed
- Biswas S, Criswell TL, Wang SE, Arteaga CL. Inhibition of transforming growth factor-beta signaling in human cancer: targeting a tumor suppressor network as a therapeutic strategy. Clin Cancer Res. 2006;12:4142–4146. - PubMed
- Cicalese A, Bonizzi G, Pasi CE, Faretta M, Ronzoni S, Giulini B, et al. The tumor suppressor p53 regulates polarity of self-renewing divisions in mammary stem cells. Cell. 2009;138:1083–1095. - PubMed
- Clarke MF, Dick JE, Dirks PB, Eaves CJ, Jamieson CH, Jones DL, et al. Cancer stem cells--perspectives on current status and future directions: AACR Workshop on cancer stem cells. Cancer Res. 2006;66:9339–9344. - PubMed
Publication types
MeSH terms
Substances
LinkOut - more resources
Full Text Sources
Other Literature Sources
Molecular Biology Databases
Research Materials
Miscellaneous
