A systematic screen for CDK4/6 substrates links FOXM1 phosphorylation to senescence suppression in cancer cells - PubMed (original) (raw)
A systematic screen for CDK4/6 substrates links FOXM1 phosphorylation to senescence suppression in cancer cells
Lars Anders et al. Cancer Cell. 2011.
Abstract
Cyclin D-dependent kinases (CDK4 and CDK6) are positive regulators of cell cycle entry and they are overactive in the majority of human cancers. However, it is currently not completely understood by which cellular mechanisms CDK4/6 promote tumorigenesis, largely due to the limited number of identified substrates. Here we performed a systematic screen for substrates of cyclin D1-CDK4 and cyclin D3-CDK6. We identified the Forkhead Box M1 (FOXM1) transcription factor as a common critical phosphorylation target. CDK4/6 stabilize and activate FOXM1, thereby maintain expression of G1/S phase genes, suppress the levels of reactive oxygen species (ROS), and protect cancer cells from senescence. Melanoma cells, unlike melanocytes, are highly reliant on CDK4/6-mediated senescence suppression, which makes them particularly susceptible to CDK4/6 inhibition.
2011 Elsevier Inc. All rights reserved.
Figures
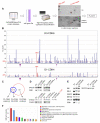
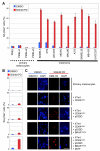
Figure 1. Proteome-Wide Identification of CDK4/6 Substrates
(A) Schematic for the approach to substrate identification. All nuclear proteins with at least two potential CDK phosphorylation sites were selected from the protein database SWISS-PROT. Candidate proteins were expressed in E. coli, purified and tested for phosphorylation by recombinant cyclin D1-CDK4 and cyclin D3-CDK6. Reaction products were analyzed by SDS-PAGE (lower panel) and autoradiography (upper panel), and relative rates of phosphorylation (PR-scores) were calculated. (B) Side-by-side comparison of phosphorylation of 285 enriched proteins by cyclin D3-CDK6 (upper panel) versus cyclin D1-CDK4 (lower panel). PR-scores are the rates of phosphorylation normalized to RB1, which was set to 100%. Proteins with PR-scores above 20% are referred to as in vitro substrates. Arrows indicate histone proteins; the three RB family proteins are highlighted in red. (C) Overlap between cyclin D1-CDK4 (blue circle) and cyclin D3-CDK6 (red circle) in vitro substrates. (D) In vitro substrates were co-expressed in HEK293 cells with either empty vector (EV) or wild-type cyclin-CDK complexes (left panel). Co-expression of wild type versus kinase-dead (KM) CDK versions is shown in the middle panel. Phosphorylated SHOX2 was treated with calf intestinal phosphatase (CIAP, right panel). (E) Collapse in the mobility shift of seven CDK4/6 substrates upon short-term treatment (40 min) with the CDK4/6 specific inhibitor, PD0332991. GST-tagged substrates plus cyclin D-CDK complexes were expressed in HEK293 cells exposed to either 1 μM of the inhibitor (PD) or DMSO (−) 30 h post-transfection. (F) ‘Biological process’ gene ontology (GO) terms were assigned to all 71 in vitro substrates. See also Figure S1 and Table S1.
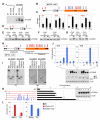
Figure 2. Cyclin D-CDK4/6 Activate FOXM1 Transcriptional Function
(A) Effects of individual and combined expression of FOXM1 and cyclin D-CDK4/6 complexes on reporter gene activation (+/−SD). Hela cells were transfected with the CCNG2, TSC22D1, IGFBP-1, 6DB, CENPF and PLK1 promoter-luciferase constructs, FOXM1 (M1), empty vector (-), cyclin D1-CDK4 (14) or cyclin D3-CDK6 (36). (B) Reporter activity (+/−SD) in Hela cells after transfection of FOXM1 (M1) and cyclin D1-CDK4 (14), or cyclin D3-CDK6 (36), versus kinase-dead (KM) versions. (C) U2OS cells stably expressing either control (sh-con) or RB1 targeting shRNA (sh-RB1) were transfected with the CCNG2 promoter-reporter, empty vector (EV, blue) or FOXM1 (pink), and treated with DMSO, 0.1 μM or 1 μM PD0332991 for 16 h. Values are mean +/−SD. (D) RB1 protein expression in control (sh-con) and RB1 knockdown (sh-RB1) cells.
Figure 3. Contribution of CDK Consensus Sites to FOXM1 Transcriptional Function
(A) Arrangement of Scansite CDK motifs in FOXM1. S4 (asterisks) is a typical S/T-P CDK site, but is not detected by Scansite, due to its close proximity to the N-terminus. FH, Forkhead domain; TAD, transactivation domain. (B) Reporter gene activation (+/−SD) in U2OS cells transfected with the 6DB luciferase plasmid plus either empty vector (EV), the FOXM1 15 site to alanine mutant (‘15A’), FOXM1 ‘add-back’ mutants or wild-type FOXM1 (WT). All ‘add-back’ (A → S/T) mutated residues are highlighted in red; mutant alanines are not shown.
Figure 4. CDK4/6 Activate FOXM1 by Multisite Phosphorylation
(A) Immunoprecipitation (IP) of endogenous FOXM1 from U2OS cells expressing either empty vector (EV), cyclin D3-CDK6, or cyclin D3 and kinase-inactive CDK6 (CDK6KM). (B and C) FOXM1 was co-expressed with either empty vector (−), or cyclin D3 and CDK6 (36), or cyclin D3 and kinase-inactive CDK6KM (36KM) in HeLa cells, immunoprecipitated and subjected to quantitative mass spectrometry. In vivo phosphorylated sites are depicted in red; black sites were not accessible to analysis; no phosphorylation was detected on blue sites. Site-specific in vivo phosphorylation quantification (+/−SD) is shown in C. (D) FOXM1 TAD deletion mutant (ΔTAD) with N-terminal CDK4/6 sites (red). (E) HeLa cells were co-transfected with either empty vector (−), or cyclin D3 and CDK6 (36), plus FOXM1ΔTAD wild-type (WT) or phosphorylation-site mutants (S4A, S35A, S331A). (F) FOXM1ΔTAD co-transfections with either empty vector (−), or cyclin D3 and CDK6 (36), or cyclin D3 and kinase-inactive CDK6KM (36KM). (G) Co-transfections with either empty vector (−), or cyclin D3 and CDK6 (36), and FOXM1ΔTAD wild-type (WT) or RXL mutant versions, in which the RXL motif was replaced by AXA. (H) FOXM1 fragments (black bars) were in vitro phosphorylated by cyclin D3-CDK6 and analyzed by mass spectrometry. Phosphorylated residues are depicted in red; unphosphorylated sites are blue; black sites were not accessible to analysis. (I) In vitro phosphorylation assay performed using recombinant cyclin D1-CDK4 or cyclin D3-CDK6 with RB1, FOXM1 middle (M) or C-terminal fragment (C), and histone H2A. P32, autoradiogram; AB, Amidoblack protein staining for total protein amounts. (J) Activation of the 6DB promoter (+/−SD) by wild-type FOXM1 (M1) versus the ‘11A’ CDK site to alanine mutant plus cyclin D1-CDK4 (14, left panel) or cyclin D3-CDK6 (36, right panel). Protein expression is shown (lower panel). (K) Effect of phosphomimetic mutations on FOXM1 transcriptional activity (+/−SD). Hela cells were transfected with the 6DB promoter and either empty vector (EV), wild-type FOXM1 (WT), or phosphomimetic mutants (S/T residue numbers replaced by aspartic acid, blue). Expression of the mutant proteins is shown in the inlet. (L) U2OS cells transfected with the 6DB promoter and either empty vector (EV), wild-type FOXM1 (WT) or the FOXM1 ‘12D’ mutant (12D) were treated with DMSO or 1μM PD0332991 (PD) for 16 h. Values are mean +/−SD. See also Figure S2.
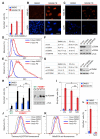
Figure 5. CDK4/6 Stabilize FOXM1 by Multisite Phosphorylation
(A) U2OS and melanoma cells (red) were incubated with DMSO or 1 μM PD0332991 (PD) for 16 h, and endogenous FOXM1 protein levels were analyzed. (B) U2OS cells stably expressing either control (sh-con) or RB1 targeting shRNA (sh-RB1) were treated with PD0332991 and endogenous FOXM1 was analyzed. (C) U2OS cells were transfected with pBABE empty vector (EV) or pBABE-FOXM1 and treated with PD0332991. (D) Cells were co-transfected with either pBABE empty vector (EV) or pBABE-FOXM1, and cyclin D1-CDK4 (14) or cyclin D3-CDK6 (36). Expression of the HA-tagged cyclins is shown below. (E) U2OS cells transfected with pBABE-FOXM1 were treated with 5 μM MG132 (MG) 4 h prior to cell lysis. (F) U2OS cells were transfected with pBABE-FOXM1 and either control (si-con) or CDH1 siRNA (si-CDH1). (G) Effect of replacing the FOXM1 N-terminal (S4/S35), 12 TAD or all 14 CDK (12 TAD plus N-terminal) sites with aspartic acid residues on FOXM1 protein levels. U2OS cells were transfected with either pBABE wild-type FOXM1 (WT), FOXM1 S4/S35 to D (S4D/S35D), ‘12D’ or ‘14D’ mutant. Cells were treated with DMSO (−) or 1μM PD0332991 (PD) for 16 h. See also Figure S3.
Figure 6. Inhibition of CDK4/6 Catalytic Activity Enforces a ROS Dependent Senescence Program by Disabling FOXM1
(A) Percentage of SA-β-galactosidase positive cells (+/−SD) among breast cancer (V720), osteosarcoma (U2OS) and melanoma (SKMEL2) cell lines, each treated with either DMSO or 500 nM PD0332991 for 8 days. (B and C) Immunofluorescence staining of U2OS cells (B) and SKMEL2 cells (C) using anti-trimethyl K9 histone H3 antibody (K9M-H3, upper panel) or DAPI (lower panel). Cells were treated with either DMSO or PD0332991 as above. Scale bar represents 10 μm. (D and E) Quantification of cellular granularity by FACS. Side scatter (SSC) analysis of U2OS (D) and SKMEL2 cells (E), treated with either DMSO or 500 nM PD0332991 as above. Graphs are from triplicate experiments. (F and G) Percentage of SA-β-galactosidase positive U2OS cells upon knockdown of CDK4/6 (F) and FOXM1 (G). Cells were transiently transfected with the indicated siRNAs, followed by 8-day PD0332991 treatment 48 h post-transfection. si-con, control siRNA; si-CDK4, CDK4-specific siRNA; si-CDK6, CDK6-specific siRNA; si1-FOXM1 and si2-FOXM1, two different siRNAs targeting FOXM1. The asterisk indicates an unspecific band. (H) Wild type (WT) and FOXM1 knockout MEFs (FOXM1-/-) were transduced with either pBABE empty vector (EV), wild type FOXM1 (WT) or the 11-site phosphorylation mutant (11), and FOXM1 expression was analyzed (right panel; asterisks indicate unspecific bands). Cells were treated with either DMSO or 100 μM of the ROS inducing drug, Imexon. SA-β-galactosidase positive cells were counted after 4 days of treatment. Error bars, mean of SD; *p<0.05, **p<0.01. (I) SA-β-galactosidase positive U2OS cells (+/−SD) transfected with either empty vector (EV), wild-type FOXM1 (WT), or the ‘12D’ mutant (expressed from the CMV promoter). Cells were treated as in F. Error bars, mean of SD; *p<0.05, **p<0.01. (J) Measurement of cytoplasmic ROS levels with Carboxy-H2DCFDA by FACS in U2OS cells treated with either DMSO or 500 nM PD0332991 for 3 and 6 days. (K) Quantification of mitochondrial ROS levels with MitoSOX red in U2OS cells treated as in J. (L) SA-β-galactosidase positive U2OS cells (+/−SD) after simultaneous incubation with 1 mM N-acetyl-cysteine (NAC) and either DMSO or PD0332991. See also Figure S4.
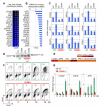
Figure 7. FOXM1 Activates Key G1/S Genes Downstream of CDK4 Function and Promotes G1/S Transition
(A and B) 19 ‘common’ cyclin D-CDK4/6-regulated genes obtained by microarray analysis from U2OS cells (A), and QPCR analysis (+/−SD) from V720 mouse mammary tumor cells (B). Each cell line was treated with either DMSO or PD0332991 for 4 h. For each cell line, genes are arranged from the highest to lowest change in expression. (C) QPCR analysis of the indicated genes in wild-type (WT) and FOXM1-/- MEFs, each stably expressing either pBABE empty vector (EV) or CDK4R24C (CDK4). Values derived from WT-EV cells were set to 1-fold change in expression. Values are mean +/−SD. (D) Protein expression of HA-tagged CDK4R24C and endogenous CDK4 (CDK4endo) in wild-type (WT) and FOXM1-/- MEFs. (E) U2OS cells were transfected with the indicated promoter-luciferase constructs plus either empty vector or FOXM1. Reporter assay results are visualized as a heat map (scale, right panel). (F and G) Wild-type (WT) and FOXM1-/- MEFs were serum starved for 48 h, followed by serum addition at the indicated time points. Cell cycle parameters (F) and mRNA expression (G) were subsequently assessed by FACS and QPCR analysis (+/−SD), respectively. See also Figure S5.
Figure 8. PD0332991-Induced Cellular Senescence is Linked to CDK4 Hyperactivation and the Transformed Phenotype
(A) Percentage of SA-β-galactosidase positive (+/−SD) primary melanocytes versus malignant melanoma cells following treatment with PD0332991 or DMSO for 8 days. (B and C) Successive transduction (top to bottom) of primary melanocytes with hTERT, CDK4R24C, dominant-negative p53 (p53DD), BRAFV600E and MITF renders these cells susceptible to PD0332991-induced senescence. Panel B shows the percentage of SA-β-galactosidase positive cells (+/−SD) following PD0332991 or DMSO treatment for 8 days. In panel C, trimethylation of histone H3 lysine 9 (K9M-H3) is visualized by immunofluorescence (red). Nuclear DNA was stained with DAPI (blue). Scale bar represents 10 μm.
Similar articles
- The CDK4/CDK6 inhibitor PD0332991 paradoxically stabilizes activated cyclin D3-CDK4/6 complexes.
Paternot S, Colleoni B, Bisteau X, Roger PP. Paternot S, et al. Cell Cycle. 2014;13(18):2879-88. doi: 10.4161/15384101.2014.946841. Cell Cycle. 2014. PMID: 25486476 Free PMC article. - Differential phosphorylation of T-47D human breast cancer cell substrates by D1-, D3-, E-, and A-type cyclin-CDK complexes.
Sarcevic B, Lilischkis R, Sutherland RL. Sarcevic B, et al. J Biol Chem. 1997 Dec 26;272(52):33327-37. doi: 10.1074/jbc.272.52.33327. J Biol Chem. 1997. PMID: 9407125 - Evidence for a CDK4-dependent checkpoint in a conditional model of cellular senescence.
Brookes S, Gagrica S, Sanij E, Rowe J, Gregory FJ, Hara E, Peters G. Brookes S, et al. Cell Cycle. 2015;14(8):1164-73. doi: 10.1080/15384101.2015.1010866. Cell Cycle. 2015. PMID: 25695870 Free PMC article. - Cyclin D1, cancer progression, and opportunities in cancer treatment.
Qie S, Diehl JA. Qie S, et al. J Mol Med (Berl). 2016 Dec;94(12):1313-1326. doi: 10.1007/s00109-016-1475-3. Epub 2016 Oct 2. J Mol Med (Berl). 2016. PMID: 27695879 Free PMC article. Review. - Multiple effects of CDK4/6 inhibition in cancer: From cell cycle arrest to immunomodulation.
Bonelli M, La Monica S, Fumarola C, Alfieri R. Bonelli M, et al. Biochem Pharmacol. 2019 Dec;170:113676. doi: 10.1016/j.bcp.2019.113676. Epub 2019 Oct 21. Biochem Pharmacol. 2019. PMID: 31647925 Review.
Cited by
- Mitigation of acute kidney injury by cell-cycle inhibitors that suppress both CDK4/6 and OCT2 functions.
Pabla N, Gibson AA, Buege M, Ong SS, Li L, Hu S, Du G, Sprowl JA, Vasilyeva A, Janke LJ, Schlatter E, Chen T, Ciarimboli G, Sparreboom A. Pabla N, et al. Proc Natl Acad Sci U S A. 2015 Apr 21;112(16):5231-6. doi: 10.1073/pnas.1424313112. Epub 2015 Apr 6. Proc Natl Acad Sci U S A. 2015. PMID: 25848011 Free PMC article. - Two sides of the Myc-induced DNA damage response: from tumor suppression to tumor maintenance.
Campaner S, Amati B. Campaner S, et al. Cell Div. 2012 Feb 28;7(1):6. doi: 10.1186/1747-1028-7-6. Cell Div. 2012. PMID: 22373487 Free PMC article. - FOXM1 and Cancer: Faulty Cellular Signaling Derails Homeostasis.
Kalathil D, John S, Nair AS. Kalathil D, et al. Front Oncol. 2021 Feb 15;10:626836. doi: 10.3389/fonc.2020.626836. eCollection 2020. Front Oncol. 2021. PMID: 33680951 Free PMC article. Review. - Forkhead Box M1 Is Essential for Nuclear Localization of Glioma-associated Oncogene Homolog 1 in Glioblastoma Multiforme Cells by Promoting Importin-7 Expression.
Xue J, Zhou A, Tan C, Wu Y, Lee HT, Li W, Xie K, Huang S. Xue J, et al. J Biol Chem. 2015 Jul 24;290(30):18662-70. doi: 10.1074/jbc.M115.662882. Epub 2015 Jun 17. J Biol Chem. 2015. PMID: 26085085 Free PMC article. - METTL14 inhibits the proliferation, migration and invasion of prostate cancer cells by increasing m6A methylation of CDK4.
Zhong X, Wang S, Yang X, Yang X, Zhou L. Zhong X, et al. Transl Androl Urol. 2024 Jul 31;13(7):1145-1163. doi: 10.21037/tau-23-682. Epub 2024 Jul 16. Transl Androl Urol. 2024. PMID: 39100843 Free PMC article.
References
- Ackermann AM, Gannon M. Molecular regulation of pancreatic beta-cell mass development, maintenance, and expansion. J Mol Endocrinol. 2007;38:193–206. - PubMed
- Bracken AP, Ciro M, Cocito A, Helin K. E2F target genes: unraveling the biology. Trends Biochem Sci. 2004;29:409–417. - PubMed
Publication types
MeSH terms
Substances
LinkOut - more resources
Full Text Sources
Other Literature Sources
Medical
Molecular Biology Databases
Research Materials
Miscellaneous
