Formation of Essential Ultrastructural Interface between Cultured Hippocampal Cells and Gold Mushroom-Shaped MEA- Toward "IN-CELL" Recordings from Vertebrate Neurons - PubMed (original) (raw)
Formation of Essential Ultrastructural Interface between Cultured Hippocampal Cells and Gold Mushroom-Shaped MEA- Toward "IN-CELL" Recordings from Vertebrate Neurons
Anna Fendyur et al. Front Neuroeng. 2011.
Abstract
Using cultured Aplysia neurons we recently reported on the development of a novel approach in which an extracellular, non-invasive multi-electrode-array system provides multisite, attenuated, intracellular recordings of subthreshold synaptic potentials, and action potentials (APs), the so called "IN-CELL" recording configuration (to differentiate it from intracellular recordings). Because of its non-invasive nature, the configuration can be used for long term semi intracellular electrophysiological monitoring of APs and synaptic potentials. Three principals converge to generate the IN-CELL configuration: (a) engulfment of approximately 1 μm size gold mushroom-shaped microelectrodes (gMμE) by the neurons, (b) formation of high seal resistance between the cell's plasma membrane and the engulfed gMμE, and (c), autonomous localized increased conductance of the membrane patch facing the gMμE. Using dissociated rat hippocampal cultures we report here that the necessary morphological and ultrastructural relationships to generate the IN-CELL recording configuration are formed between hippocampal cells and the gMμEs. Interestingly, even <1 μm thin branches expand and engulf the gMμE structures. Recordings of spontaneous electrical activity revealed fast ∼2 ms, 0.04-0.75 mV positive monophasic APs (FPMP). We propose that the FPMP are attenuated APs generated by neurons that engulf gMμEs. Computer simulations of analog electrical circuits depicting the cell-gMμE configuration point out the parameters that should be altered to improve the neuron-gMμE electrical coupling.
Keywords: MEA; action potential; electrical coupling; field potentials; gold mushroom-shaped microelectrodes; multi-electrode-array.
Figures
Figure 1
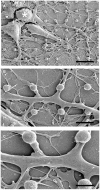
SEM images of dissociated cultured rat hippocampal cells grown on a matrix of gMμP functionalized with PEI for 6 days. (A) A low magnification showing a neuron (upper left) and a non-neuronal cell (lower right). The white arrows denote the location of three gMμPs residing below the neuron. (B) A close-up image of a single gMμP partially engulfed by a neurite. (C) Thin branches expand to engulf gMμPs. (D) A close-up image of thin branches engulfing a single gMμP. [Scale bars denote 5 μm for (A), 1 μm for **(B–D)**].
Figure 2
SEM images of a single rat hippocampal neuron grown on a matrix of gMμP engulfing a number of gMμPs. The images were prepared from cultures grown on PEI for 6 days. (A) A low magnification micrograph showing three neurons and their neurites. (B,C) enlargements of the neurite extending from the cell body marked by an asterisk in (A). Note that this single neurite engulfs a number of gMμPs. [Scale bars denote 12, 5, and 2.5 μm for (A–C), respectively].
Figure 3
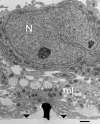
TEM image of cultured hippocampal cells grown on a matrix of gMμPs functionalized by PEI. Low magnification image revealing that in some parts of the cultures the cell bodies reside on top of a layer of branches that do not form direct physical contact with the gMμPs. Note that only a small part of the shown gold mushrooms “cap” is in contact with the branches. Images are from a 10-days old culture. N, Nucleus; mt, mitochondria; area of flat gold substrate-arrowheads. Scale bar: 1 μm.
Figure 4
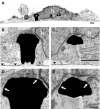
TEM images of a cultured hippocampal cell engulfing three gMμPs. (A) A low magnification micrograph of a cell body engulfing three gMμPs (asterisks). (B–E) enlargements of the junctions formed between the cell and two of the gMμPs. The arrows in (D,E) point to regions of tight apposition between the cell’s plasma membrane and the PEI functionalized surface of the gMμPs. Images are from a 10-days old culture. N, Nucleus; mt, mitochondria; the horizontal straight lines in (B,C) depict area of flat gold substrate-arrowheads. Scale bar for (A–C) 1 μm and for (D,E) 250 nm.
Figure 5
Analysis of the cleft width formed between hippocampal cells grown on functionalized matrixes of gMμPs. For the experiments the gMμPs were functionalized by PEI, PDL + laminin, and the engulfment promoting peptide EPP. (A,B) The cleft width was measured along two areas, the surface of the mushrooms’ “cap” (marked I), and along the upper part of the stalk (marked II). Measurements were conducted at points defined by a randomly placed grid on a TEM image. In the majority of the TEM images the lower part of the gold mushroom’s stalk was not tightly engulfed and not measured (marked III, yellow). Ruptured agar, appearing as clear white areas in the TEM images, were not included in the analysis (see text). Calibration 1 μm. (C) Independent of the chemical functionalization, the cleft width along the mushrooms cap surface was close to zero. Along the upper part of the stalk the gap was ≪ 40 nm, and along the lower part of the stalk ≫ 40 nm.
Figure 6
Estimation of the seal resistance by the shape of the voltage calibration pulse. Using the analog electrical circuit depicting the gMμE – hippocampal cells junction (A), we simulated the expected shape of a 1-mV voltage calibration pulse delivered to the bathing solution (voltage calibration) and compared it to the actual recorded calibration pulse by the gMμE. (B) depicts the experimentally recorded voltage calibration of Figure 7 (neuron, 62) and that of Figure 8 (electrode 85). (C) The electrical parameters to simulate a neuron and a tentative glia cell are given in the Section “Materials and Methods.” The simulation was conducted for neurons and tentative glia with Rj of 100 GΩ and 5 GΩ, while the seal resistance _R_seal was altered from 100 kΩ to 100 GΩ (see color coding). The voltage calibration pulse (1 mV) delivered to the bathing solution and recorded by the gMμE is depicted in black. Note that in the simulation the time constant of the calibration pulses as seen by the gMμE, depends on the value of _R_seal and the junctional membrane resistance. The time constant of the experimentally recorded calibration pulses is shorter than the simulated for _R_seal = 100 MΩ. In the schematic drawing _R_gMμE and _C_gMμE are depicted by Re and Ce respectively. Ra and Ca are the amplifier resistance and capacitance respectively. Note: the downward drift of the experimentally recorded calibration pulse (electrode 62 and 85) is due to the properties of the AC amplifier used (charged is leaking to the ground). The simulation model depicts a DC amplifier.
Figure 7
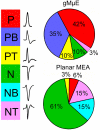
Categorization of the dominant spike waveforms detected by planar and gMμE based MEA. The waveforms of spontaneous spikes recorded by planar and gMμE based MEA were sorted by their dominant positive or negative polarity and shape to monophasic, biphasic, and triphasic. Note that whereas the majority of the waveforms recorded by the planar MEA are of negative going spikes, the recorded potentials by the gMμE based MEA are positive. P, positive spike; PB, positive bi-phase spike; PT, positive tri-phase spike; N, negative spike; NB, negative bi-phase spike; NT, negative tri-phase spike.
Figure 8
Recordings of spontaneous fast monophasic positive action potentials (FMPP) generated by cultured hippocampal neurons grown on a PEI functionalized gMμEs based MEA for 10 days. (A) Spontaneous trains of FPMP generated by three neurons (one coupled to electrode 62, the second coupled to three electrodes 17, 36, and 27 and the third to electrode 38). The distance between electrodes 27 and 36 is approximately 40 μm. (B) The location of the electrodes that picked up the spike activity is depicted on a schematic layout of the MEA. (C) The potential recorded by electrodes 62, 17, and 38 in (A) are enlarged. (D) A 1-mV, 20 ms square calibration pulse delivered to the bathing solution and recorded by electrode 62.
Figure 9
Recordings of spontaneous long-lasting potentials (LLP) presumably generated by cultured glia cells grown on PEI functionalized gMμEs based MEA for 10 days. (A) Spontaneous synchronized LLPs recorded by seven gMμEs. Six gMμEs recorded synchronized monophasic negative going potentials (electrode number 64, 65, 74, 75, 76, and 84) while one electrode (85) recorded mirror image positive going potentials. (B) Enlargement of the mirror image LLPs recorded by electrodes 85 and 75. (C) A calibration pulse of 1 mV 20 ms. As recorded by electrode 85 (D) The location of the gMμEs that picked up the LLPs is depicted on a schematic layout of the MEA. Note that the cell generating these LLPs extends over an area of approximately 60 μm × 60 μm.
Figure 10
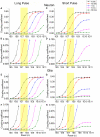
Simulation of the estimated coupling coefficient between neurons or glia with gMμEs. For the simulation we used the electrical circuit depicted in Figure 6. The simulation was conducted by injection of a long [250 ms **(A,B,E,F)**] and short [2 ms **(C,D,G,H)**] square current pulse. (A–D) simulation of the electrical coupling coefficient of a neuron and a gMμEs as a function of _R_seal, (E–H) simulation of the coupling coefficient between a tentative glia cell and a gMμEs as a function of _R_seal (in Ohms) at various Rj ranging between 100 GΩ and 10 MΩ (see color coding). (B,D,F,H) are respective y-zooms into (A,C,E,G). The yellow squares emphasize the expected coupling coefficient values when _R_seal is set to the values estimated by the experiments in the range of 10–100 MΩ. The expected coupling coefficient for neurons and glia cells with junctional resistance of 10–100 GΩ is given by the _Y_-axis values corresponding to the red line within the yellow box.
Figure A1
The growth pattern of the hippocampal cells on poly-d-lysine/laminin versus EPP. Retrospective immunolabeling of 20 days old hippocampal cells grown on poly-
d
-lysine (A) and EPP (B): neurons (green), glial cells (blue), counterstained with nuclear marker DAPI (red). Scale bar: 50 μm. Neurons were labeled for neuron-specific intermediate filaments with mouse anti NF antibodies followed by goat anti-mouse secondary antibodies conjugated to Cyanine 2 (Cy2). Glial cells were labeled for glial fibrillary acidic proteins with primary anti-GFAP rabbit monoclonal antibodies followed by goat anti-rabbit secondary antibodies conjugated to Cy3. Confocal imaging was done using D-Eclipse C1 imaging system (Nikon) mounted on an Eclipse TE-2000 microscope (Nikon). Images were collected and processed using EZ-C1 software (Nikon). Scanning was done in sequential mode: red was excited with 543 nm He–Ne laser and collected with 605 ± 75 band pass filter; green was excited with 488 nm Argon laser and collected with 515 ± 30 band pass filter; blue excited with 405 nm Diode and collected with 450 ± 35 band pass filter. Images were prepared using the open-source image analysis program ImageJ (NIH, USA). Hippocampal cells grown on the EPP clustered to form bundles and aggregates in which the glia cells formed a sheet in contact with the substrate and the neurons grew on top. Cells in different aggregates interconnect by thick fascicles emanating from clusters and projecting to adjacent aggregates.
Similar articles
- A feasibility study of multi-site,intracellular recordings from mammalian neurons by extracellular gold mushroom-shaped microelectrodes.
Ojovan SM, Rabieh N, Shmoel N, Erez H, Maydan E, Cohen A, Spira ME. Ojovan SM, et al. Sci Rep. 2015 Sep 14;5:14100. doi: 10.1038/srep14100. Sci Rep. 2015. PMID: 26365404 Free PMC article. - On-chip electroporation, membrane repair dynamics and transient in-cell recordings by arrays of gold mushroom-shaped microelectrodes.
Hai A, Spira ME. Hai A, et al. Lab Chip. 2012 Aug 21;12(16):2865-73. doi: 10.1039/c2lc40091j. Epub 2012 Jun 7. Lab Chip. 2012. PMID: 22678065 - Toward on-chip, in-cell recordings from cultured cardiomyocytes by arrays of gold mushroom-shaped microelectrodes.
Fendyur A, Spira ME. Fendyur A, et al. Front Neuroeng. 2012 Aug 24;5:21. doi: 10.3389/fneng.2012.00021. eCollection 2012. Front Neuroeng. 2012. PMID: 22936913 Free PMC article. - Multisite Intracellular Recordings by MEA.
Spira ME, Huang SH, Shmoel N, Erez H. Spira ME, et al. Adv Neurobiol. 2019;22:125-153. doi: 10.1007/978-3-030-11135-9_5. Adv Neurobiol. 2019. PMID: 31073934 Review. - In vitro microelectrode array technology and neural recordings.
Nam Y, Wheeler BC. Nam Y, et al. Crit Rev Biomed Eng. 2011;39(1):45-61. doi: 10.1615/critrevbiomedeng.v39.i1.40. Crit Rev Biomed Eng. 2011. PMID: 21488814 Review.
Cited by
- Electrokinetic confinement of axonal growth for dynamically configurable neural networks.
Honegger T, Scott MA, Yanik MF, Voldman J. Honegger T, et al. Lab Chip. 2013 Feb 21;13(4):589-98. doi: 10.1039/c2lc41000a. Lab Chip. 2013. PMID: 23314575 Free PMC article. - Architecture design and advanced manufacturing of heart-on-a-chip: scaffolds, stimulation and sensors.
Xu F, Jin H, Liu L, Yang Y, Cen J, Wu Y, Chen S, Sun D. Xu F, et al. Microsyst Nanoeng. 2024 Jul 11;10:96. doi: 10.1038/s41378-024-00692-7. eCollection 2024. Microsyst Nanoeng. 2024. PMID: 39006908 Free PMC article. Review. - Ultrastructural Analysis of Neuroimplant-Parenchyma Interfaces Uncover Remarkable Neuroregeneration Along-With Barriers That Limit the Implant Electrophysiological Functions.
Sharon A, Shmoel N, Erez H, Jankowski MM, Friedmann Y, Spira ME. Sharon A, et al. Front Neurosci. 2021 Nov 22;15:764448. doi: 10.3389/fnins.2021.764448. eCollection 2021. Front Neurosci. 2021. PMID: 34880722 Free PMC article. - High Aspect Ratio and Light-Sensitive Micropillars Based on a Semiconducting Polymer Optically Regulate Neuronal Growth.
Milos F, Tullii G, Gobbo F, Lodola F, Galeotti F, Verpelli C, Mayer D, Maybeck V, Offenhäusser A, Antognazza MR. Milos F, et al. ACS Appl Mater Interfaces. 2021 May 26;13(20):23438-23451. doi: 10.1021/acsami.1c03537. Epub 2021 May 13. ACS Appl Mater Interfaces. 2021. PMID: 33983012 Free PMC article. - Recent advances in bioelectronics chemistry.
Fang Y , Meng L , Prominski A , Schaumann EN , Seebald M , Tian B . Fang Y , et al. Chem Soc Rev. 2020 Nov 21;49(22):7978-8035. doi: 10.1039/d0cs00333f. Epub 2020 Jul 16. Chem Soc Rev. 2020. PMID: 32672777 Free PMC article. Review.
References
- Berdondini L., Massobrio P., Chiappalone M., Tedesco M., Imfeld K., Maccione A., Gandolfo M., Koudelka-Hep M., Martinoia S. (2009). Extracellular recordings from locally dense microelectrode arrays coupled to dissociated cortical cultures. J. Neurosci. Methods 177, 386–39610.1016/j.jneumeth.2008.10.032 - DOI - PubMed
LinkOut - more resources
Full Text Sources
Other Literature Sources
Miscellaneous

