Single point mutation in Bin/Amphiphysin/Rvs (BAR) sequence of endophilin impairs dimerization, membrane shaping, and Src homology 3 domain-mediated partnership - PubMed (original) (raw)
Single point mutation in Bin/Amphiphysin/Rvs (BAR) sequence of endophilin impairs dimerization, membrane shaping, and Src homology 3 domain-mediated partnership
Anna Gortat et al. J Biol Chem. 2012.
Abstract
Bin/Amphiphysin/Rvs (BAR) domain-containing proteins are essential players in the dynamics of intracellular compartments. The BAR domain is an evolutionarily conserved dimeric module characterized by a crescent-shaped structure whose intrinsic curvature, flexibility, and ability to assemble into highly ordered oligomers contribute to inducing the curvature of target membranes. Endophilins, diverging into A and B subgroups, are BAR and SH3 domain-containing proteins. They exert activities in membrane dynamic processes such as endocytosis, autophagy, mitochondrial dynamics, and permeabilization during apoptosis. Here, we report on the involvement of the third α-helix of the endophilin A BAR sequence in dimerization and identify leucine 215 as a key residue within a network of hydrophobic interactions stabilizing the entire BAR dimer interface. With the combination of N-terminal truncation retaining the high dimerization capacity of the third α-helices of endophilin A and leucine 215 substitution by aspartate (L215D), we demonstrate the essential role of BAR sequence-mediated dimerization on SH3 domain partnership. In comparison with wild type, full-length endophilin A2 heterodimers with one protomer bearing the L215D substitution exhibit very significant changes in membrane binding and shaping activities as well as a dramatic decrease of SH3 domain partnership. This suggests that subtle changes in the conformation and/or rigidity of the BAR domain impact both the control of membrane curvature and downstream binding to effectors. Finally, we show that expression, in mammalian cells, of endophilin A2 bearing the L215D substitution impairs the endocytic recycling of transferrin receptors.
Figures
FIGURE 1.
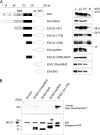
Differential binding of EA1 and truncated forms to proline-rich peptides. A, left, rod structure of full-length EA1 and truncations (Δ) encompassing the SH3 domain and/or the first, second, and third helices (α1, α2, and α3, respectively) of the BAR sequence as well as half (EA1(1/2var)SH3) or the entire (EA1varSH3) variable region (var). Note that α1 is broken by a peptide sequence that folds into a central amphipathic helix that is not depicted here (residues 63–86). Right, binding of full-length and truncated forms on poly-
l
-proline/Sepharose. Lysates (L) from bacteria were centrifuged, and supernatants were loaded (Lo) onto poly-
l
-proline/Sepharose columns for affinity chromatography. Samples from the lysates and equal proportions of samples from the load, the flow-through (Ft), and the eluted proteins (E) were run on SDS-PAGE and analyzed for protein content by Western blotting using an anti-EA1 polyclonal antiserum or StrepTactin-HRP recognizing the N-terminal StrepTag (for EA1(1/2var)SH3 and EA1SH3). aa, amino acids. B, cytosolic tail of ADAM15 fused to GST (GST/ADAM15-CT) was used as bait to recruit the indicated truncated forms of EA1 fused to an N-terminal StrepTag using protein/protein overlay assays. After SDS-PAGE and transfer of GST/ADAM15-CT on nitrocellulose membrane, individual strips were incubated in the presence of high speed supernatants from bacteria containing, or not (control), the equivalent of 3 μg/ml of the indicated EA1 fragments fused to a StrepTag (St). Top panel, protein complexes on nitrocellulose were revealed using StrepTactin-HRP. Bottom panel, aliquots of equal volume of the high speed supernatants diluted in TBST-BSA and used for incubation with the membranes were analyzed for their content in EA1 truncated forms by Western blot (WB) using StrepTactin-HRP. Note the presence in the high speed supernatants of the bacterial biotin-carboxyl carrier protein (22.5 kDa), which is recognized by StrepTactin-HRP. The volume of the high speed supernatant used for the control incubation obtained from bacteria transformed with empty plasmid was adjusted to the content in biotin-carboxyl carrier protein of the other samples.
FIGURE 2.
KKKR tetrapeptide in EA1 does not control SH3-mediated partnership. A, SDS-PAGE-Western blot analysis of full-length EA1 and the EA1KA, EA1Δ(1–169), and EA1Δ(1–175) mutants binding to poly-
l
-proline. Recombinant endophilins (2 μ
m
final concentration) were incubated with poly-
l
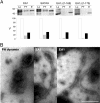
-proline-coupled beads. Fractions are defined as in Fig. 1_A_ (Lo, FT). Bound material was eluted with 50% DMSO in PBS (E). After electrotransfer, proteins were revealed (upper panel) with StrepTactin-HRP for quantification. Results expressed (lower panel) as a percentage of the amount of loaded protein reveal similar binding behavior for the wild type and mutant endophilins. B, negative stain EM of liposomes following incubation with EA1. Binding results in the formation of tubules (30–35 nm in diameter), absent after incubation with the pleckstrin homology (PH) domain of dynamin taken as control. Bar, 500 nm.
FIGURE 3.
Deletion of the two N-terminal helices of the BAR sequence does not impair dimerization. Full-length EA1 and (EA1Δ(1–175)) were incubated in the absence (−lip) or the presence of liposomes (+lip) obtained from bovine brain lipid extract. At the end of the incubation period, the chemical cross-linker 1-ethyl-3-[3-dimethylaminopropyl]carbodiimide hydrochloride (EDC) was added or not to reach the indicated final concentrations. Samples were subsequently analyzed by Western blotting to test the capacity of the proteins to form oligomers. X1, monomers; X2, dimers.
FIGURE 4.
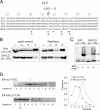
Single point mutation in α3 impairs dimerization. A, structure-based sequence alignment of BAR sequence α3 of endophilin A members through species. EA1, EA2, and EA3 are mouse endophilins A1, A2, and A3 sequences (SwissProt accession number Q62420, Q62419, and Q62421 respectively); DEA corresponds to Drosophila endophilin A (SwissProt accession number Q8T390); CEEA corresponds to Caenorhabditis elegans endophilin A (WormBase accession number CE37042). Residues in gray and pointed by triangles (see text) are conserved through species and have been subjected to mutagenesis. Residues pointed by asterisks are involved in dimerization (13). B, substitution of leucine 215 impairs binding to poly-
l
-proline. Lysates obtained from bacteria expressing EA1Δ(1–175) or the corresponding form bearing the L215D substitution (EA1LDΔ(1–175)) were tested for their ability to interact with poly-
l
-proline as in Fig. 1_A_ or purified on StrepTactin/Sepharose. L, lysate; Lo, load; Ft, flow-through; E, eluate. C and D, substitution of leucine 215 impairs dimerization. Proteins purified on StrepTactin/Sepharose were incubated with the indicated concentrations of the chemical cross-linker BS3. Monomers (X1) and dimers (X2) were detected after SDS-PAGE and blotting with StrepTactin-HRP (C) or subjected to ultracentrifugation on sucrose gradient ((D) fraction 1; top of the gradient). Arrowheads indicate the shift in sedimentation coefficients and the fractions at which the highest signals were detected (see quantification of ECL signals on the right).
FIGURE 5.
Dimerization is required for SH3 domain-mediated partnership. EA1 and EA2 with the indicated deletions (Δ(1–175) and Δ(1–175)ΔSH3), either combined or not with the L215D substitution, were assayed for the ability to recognize SH3 domain binding partners from brain cytosol (top panels) or purified ADAM15-CT (bottom panels) using protein/protein overlay assays. In the top panels, both EA1Δ(1–175) and EA2Δ(1–175) bind to dynamin (∼100 kDa (*), the presence of which was confirmed by separate immunoblotting (not shown)) and to synaptojanin (∼145 kDa (**)).
FIGURE 6.
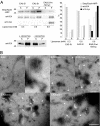
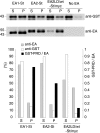
L215D substitution in EA2 does not prevent binding to liposomes but triggers the formation of altered membrane structures. A, liposome binding assay was performed as in Fig. 2_B_ by incubating liposomes (0.3 or 0.6 m
m
total phospholipids as indicated) with either EA2 or the heterodimer EA2LD/EA2 (EA2LD/WT). This dimer was obtained as described under “Experimental Procedures” and harbors a StrepTag (EA2LD protomer) and a myc tag (wild type protomer). Detection of the tags and of endophilin immunoreactivity after electrotransfer (left, upper panel) was performed using StrepTactin-HRP, anti-myc and anti-EA antibodies, respectively, for unbound (S) and liposome-bound (P) fractions. ECL signals were quantified (right). Results are expressed as a percentage of the total recovered material in each condition. Note the presence of the mutant protomer in the liposome fraction and the higher binding ability of EA2LD/WT as compared with EA2. Note the very different partitioning of EA2LD/WT between S and P when the heterodimer was incubated either in the presence or in the absence of liposomes (0.3 m
m
), with 58 and 4% of the input material recovered in the pellet, respectively. B, negative stain EM of liposomes after exposure to EA2 or to EA2LD/WT showing, in the latter case, formation of higher diameter tubes with constrictions (arrows) and of numerous small particles (arrowheads). Clusters of spheres (rectangles) were abundantly formed in the presence of EA2LD/WT (also see
supplemental Fig. 5
). Bar, 500 nm.
FIGURE 7.
L215D substitution in EA2 reduces SH3 domain-mediated binding of the dynamin PRD by liposome-bound endophilin. Liposome binding assay was performed by incubating the recombinant PRD of dynamin fused to GST (GST-PRD, 1 μ
m
final concentration) and liposomes in the presence or absence of the indicated endophilins or EA2LD/WT heterodimer for 20 min at 25 °C. Co-sedimentation was determined by SDS-PAGE-Western blot analysis of unbound (supernatant, S) and liposome-bound (pellet, P) material using GST and endophilin immunoreactivities. Distributions of endophilins and GST-PRD are expressed as a percentage of the respective total material recovered. Black blocks represent the ratio of GST-PRD to endophilin in the liposome fraction. In the case of the EA2LD/WT heterodimer, note that the dramatic decrease of the ratio indicates that the mutation in EA2LD strongly impedes PRD recognition by the SH3-domain of bound wild type EA2 endophilins.
FIGURE 8.
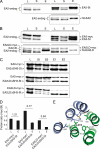
Leucine 215 is a central residue involved in full-length BAR dimerization. A–D, HeLa cells were transfected to express, or co-express, the indicated N- or C-terminal myc and StrepTag (St) EA2 fusion proteins (full-length and ΔSH3 ones) and measure their ability to interact either with endogenous EA2 (EA2-endog, A) or with each other (B and C) by co-precipitation on StrepTactin/Sepharose. The different epitope-tagged EA2 versions (varying in their respective molecular weights) were analyzed in cell lysates (L), StrepTactin/Sepharose supernatants (S), and eluates (E) by immunoblotting using a polyclonal antiserum recognizing the N terminus of EA2. Note that in A, the left panels (L, S) correspond to cells transfected with empty vector and show the migration of endogenous EA2 as well as the absence of nonspecific binding on StrepTactin/Sepharose. Note also that in B, the top panels (L, S) correspond to cells expressing EA2-myc and used as negative control to show that myc-tagged proteins do not interact with StrepTactin/Sepharose. C, lysates were split in two independent samples to perform precipitation assays in duplicate with the corresponding pairs S1/E1 and S2/E2. D, chemiluminescence obtained from immunoblots and corresponding to the myc and StrepTag fusion proteins was captured and quantified in L and E (for E, the value represents the mean of signals obtained in E1 and E2). Results were expressed as the ratio of signals of myc to St forms in L and E, respectively (protein ratio (myc/St)). Error bar for each E value corresponds to the variation to the mean for E1 and E2. The numbers between black columns correspond to the L/E ratio for each condition and give an estimation of the respective efficiency of co-precipitation of the two forms present in each lysate. A value close to 1 indicates that the two forms in the lysate can be precipitated with ∼1:1 molar ratio, which is the case for wild type EA2 monomers not bearing the L215D substitution (EA2-myc/EA2ΔSH3-St, L/E ratio = 1.21 and EA2-myc/EA2-St, L/E ratio = 1.14 (not shown)). The highest value obtained for EA2LD dimers (EA2LD-myc/EA2LDΔSH3-St, L/E ratio = 3.84) is in agreement with the significant decrease in affinity between monomers bearing the L215D substitution. E, model reconstituted from EA1 BAR domain structure and focusing on the hydrophobic interface built up by residues in the three α-helices of each BAR monomer (each represented in a given color) and localized in the vicinity of residue Leu-215. Note the central location of residue Leu-215 in this network of hydrophobic interactions (W. Weissenhorn, personal communication).
FIGURE 9.
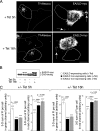
EA2LD expression interferes with transferrin uptake. HeLa/T-REx cells were treated or not with 5 μg/ml Tet for 5 and 16 h to induce the expression of EA2LD fused to a C-terminal myc tag (EA2LD-myc). A, fluorescence microscopy using ApoTome sectioning. After 5 and 16 h of Tet induction, cells were incubated for 20 min in the presence of 10 μg/ml Tf-Alexa 563. Expression of EA2LD was monitored by immunofluorescence using anti-myc primary antibodies and secondary antibodies coupled to Alexa Fluor 488. Right panels, EA2LD mainly localizes as an apparent soluble pool in the cytosol as well as on convoluted structures at or beneath the plasma membrane (arrows). Left panels, comparison between cells that express or not EA2LD of the respective localizations of Tf-Alexa 563 (for quantitative analysis, see C). Note, in cells that do not express EA2LD significantly, the accumulation of Tf-Alexa 563 in perinuclear regions corresponding to recycling endosomes as well as the important decrease of signal in this region for cells that express EA2LD. Bar, 10 μm. B, HeLa/T-REx lysates from cells treated or not with Tet for 5 and 16 h were analyzed by immunoblotting using antibodies recognizing the N terminus of endophilin A. Quantitative analysis of ECL signals corresponding to EA2LD-myc and endogenous EA2 (EA2-endog) revealed that EA2LD was expressed ∼2- and 3-fold above endogenous level, after 5 and 16 h of Tet induction, respectively. This calculation takes into account that ∼20% of cells express the mutant above background (see quantitative analysis of fluorescence in C). C, quantitative analysis of EA2LD-myc expression levels and fluorescent transferrin (Tf) uptake. After treatment or not with Tet (+/−Tet), HeLa/T-REx cells were incubated in the presence of Tf-Alexa 563 and processed for immunofluorescence as in A. Series of contiguous confocal Z-sections of images, including the entire cellular volume, were captured at emission wavelength of each fluorophore (see “Experimental Procedures”). Fluorescence intensities integrated in the entire volume of each cell (three-dimensional sum of fluorescence intensities per cell) in a given field and for both red and green channels were measured using IMARIS software. Three categories of cells were analyzed as follows: cells not treated with Tet (EA2LD nonexpressing cells (−Tet)); cells treated with Tet but for which the fluorescence in the green channel is in the range of the background measured from nontreated cells (EA2LD nonexpressing cells (+Tet)), and cells treated with Tet but for which the fluorescence in the green channel is above fluorescence background (EA2LD expressing cells (+Tet)). This quantitative analysis revealed that the expression level of EA2LD, after 16 h of Tet induction, corresponds to 1.35-fold that measured after 5 h (compare white boxes of left plots at 5 and 16 h +/− Tet induction, green channel), which is in agreement with results obtained from immunoblots in B. Note that the values in the green channel obtained from EA2LD nonexpressing cells (black and gray boxes) correspond to background. Note the small but quite significant decrease, at 5 and 16 h +/−Tet induction, of Tf uptake (red channel) by cells that express EA2LD (white boxes) in comparison with the internal control condition (black boxes). n = 240 and 210 cells for EA2LD expressing cells (+Tet); n = 429 and 275 cells for EA2LD nonexpressing cells (+Tet); n = 237 and 204 cells for EA2LD nonexpressing cells (−Tet), each one of the two values per condition corresponding to cells treated for 5 or 16 h, respectively. p values were obtained from Student's t test. *** indicates p values < 0.0001.
Similar articles
- Roles of amphipathic helices and the bin/amphiphysin/rvs (BAR) domain of endophilin in membrane curvature generation.
Jao CC, Hegde BG, Gallop JL, Hegde PB, McMahon HT, Haworth IS, Langen R. Jao CC, et al. J Biol Chem. 2010 Jun 25;285(26):20164-70. doi: 10.1074/jbc.M110.127811. Epub 2010 Apr 23. J Biol Chem. 2010. PMID: 20418375 Free PMC article. - Endophilin recruitment drives membrane curvature generation through coincidence detection of GPCR loop interactions and negative lipid charge.
Mondal S, Narayan KB, Powers I, Botterbusch S, Baumgart T. Mondal S, et al. J Biol Chem. 2021 Jan-Jun;296:100140. doi: 10.1074/jbc.RA120.016118. Epub 2020 Dec 6. J Biol Chem. 2021. PMID: 33268381 Free PMC article. - The Bin/amphiphysin/Rvs (BAR) domain protein endophilin B2 interacts with plectin and controls perinuclear cytoskeletal architecture.
Vannier C, Pesty A, San-Roman MJ, Schmidt AA. Vannier C, et al. J Biol Chem. 2013 Sep 20;288(38):27619-27637. doi: 10.1074/jbc.M113.485482. Epub 2013 Aug 6. J Biol Chem. 2013. PMID: 23921385 Free PMC article. - BAR domain proteins-a linkage between cellular membranes, signaling pathways, and the actin cytoskeleton.
Carman PJ, Dominguez R. Carman PJ, et al. Biophys Rev. 2018 Dec;10(6):1587-1604. doi: 10.1007/s12551-018-0467-7. Epub 2018 Nov 19. Biophys Rev. 2018. PMID: 30456600 Free PMC article. Review. - F-BAR family proteins, emerging regulators for cell membrane dynamic changes-from structure to human diseases.
Liu S, Xiong X, Zhao X, Yang X, Wang H. Liu S, et al. J Hematol Oncol. 2015 May 9;8:47. doi: 10.1186/s13045-015-0144-2. J Hematol Oncol. 2015. PMID: 25956236 Free PMC article. Review.
Cited by
- Identification and characterization of Rvs162/Rvs167-3, a novel N-BAR heterodimer in the human fungal pathogen Candida albicans.
Gkourtsa A, van den Burg J, Strijbis K, Avula T, Bijvoets S, Timm D, Hochstenbach F, Distel B. Gkourtsa A, et al. Eukaryot Cell. 2015 Feb;14(2):182-93. doi: 10.1128/EC.00282-14. Epub 2014 Dec 29. Eukaryot Cell. 2015. PMID: 25548150 Free PMC article. - Endophilin B2 promotes inner mitochondrial membrane degradation by forming heterodimers with Endophilin B1 during mitophagy.
Wang YH, Wang JQ, Wang Q, Wang Y, Guo C, Chen Q, Chai T, Tang TS. Wang YH, et al. Sci Rep. 2016 Apr 26;6:25153. doi: 10.1038/srep25153. Sci Rep. 2016. PMID: 27112121 Free PMC article. - Autoinhibition of endophilin in solution via interdomain interactions.
Vázquez FX, Unger VM, Voth GA. Vázquez FX, et al. Biophys J. 2013 Jan 22;104(2):396-403. doi: 10.1016/j.bpj.2012.12.009. Biophys J. 2013. PMID: 23442861 Free PMC article. - Phosphatidylinositol 4,5-bisphosphate (PtdIns(4,5)P2) specifically induces membrane penetration and deformation by Bin/amphiphysin/Rvs (BAR) domains.
Yoon Y, Zhang X, Cho W. Yoon Y, et al. J Biol Chem. 2012 Oct 5;287(41):34078-90. doi: 10.1074/jbc.M112.372789. Epub 2012 Aug 11. J Biol Chem. 2012. PMID: 22888025 Free PMC article. - Membrane curvature and its generation by BAR proteins.
Mim C, Unger VM. Mim C, et al. Trends Biochem Sci. 2012 Dec;37(12):526-33. doi: 10.1016/j.tibs.2012.09.001. Epub 2012 Oct 8. Trends Biochem Sci. 2012. PMID: 23058040 Free PMC article. Review.
References
- Tarricone C., Xiao B., Justin N., Walker P. A., Rittinger K., Gamblin S. J., Smerdon S. J. (2001) The structural basis of Arfaptin-mediated cross-talk between Rac and Arf signaling pathways. Nature 411, 215–219 - PubMed
- Peter B. J., Kent H. M., Mills I. G., Vallis Y., Butler P. J., Evans P. R., McMahon H. T. (2004) BAR domains as sensors of membrane curvature. The amphiphysin BAR structure. Science 303, 495–499 - PubMed
- Saarikangas J., Zhao H., Pykäläinen A., Laurinmäki P., Mattila P. K., Kinnunen P. K., Butcher S. J., Lappalainen P. (2009) Molecular mechanisms of membrane deformation by I-BAR domain proteins. Curr. Biol. 19, 95–107 - PubMed
Publication types
MeSH terms
Substances
LinkOut - more resources
Full Text Sources
Molecular Biology Databases
Miscellaneous
