Distinct and complex bacterial profiles in human periodontitis and health revealed by 16S pyrosequencing - PubMed (original) (raw)
Distinct and complex bacterial profiles in human periodontitis and health revealed by 16S pyrosequencing
Ann L Griffen et al. ISME J. 2012 Jun.
Abstract
Periodontitis has a polymicrobial etiology within the framework of a complex microbial ecosystem. With advances in sequencing technologies, comprehensive studies to elucidate bacterial community differences have recently become possible. We used 454 sequencing of 16S rRNA genes to compare subgingival bacterial communities from 29 periodontally healthy controls and 29 subjects with chronic periodontitis. Amplicons from both the V1-2 and V4 regions of the 16S gene were sequenced, yielding 1,393,579 sequences. They were identified by BLAST against a curated oral 16S database, and mapped to 16 phyla, 106 genera, and 596 species. 81% of sequences could be mapped to cultivated species. Differences between health- and periodontitis-associated bacterial communities were observed at all phylogenetic levels, and UniFrac and principal coordinates analysis showed distinct community profiles in health and disease. Community diversity was higher in disease, and 123 species were identified that were significantly more abundant in disease, and 53 in health. Spirochaetes, Synergistetes and Bacteroidetes were more abundant in disease, whereas the Proteobacteria were found at higher levels in healthy controls. Within the phylum Firmicutes, the class Bacilli was health-associated, whereas the Clostridia, Negativicutes and Erysipelotrichia were associated with disease. These results implicate a number of taxa that will be targets for future research. Some, such as Filifactor alocis and many Spirochetes were represented by a large fraction of sequences as compared with previously identified targets. Elucidation of these differences in community composition provides a basis for further understanding the pathogenesis of periodontitis.
Figures
Figure 1
Circular maximum likelihood phylogenetic tree at level of genus. The inner band shows genera colored by phylum or class (see key for taxa with multiple members), the next band shows significant mean differences between healthy controls and deep pockets (colored green for genera higher in healthy pockets and red for genera higher in disease pockets), and the outer band shows overall relative abundance. The tree was constructed in iTOL (Letunic and Bork, 2007).
Figure 2
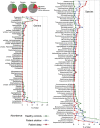
Differences between health and disease at level of phylum, genus and species. Pie charts show the number of taxa that were significantly different. The graphs show levels for genera that were ⩾0.1% different and species that were ⩾0.2% different in health and periodontitis samples. Taxa were sorted according to magnitude of change. _P_⩽0.05 after FDR correction for all taxa shown.
Figure 3
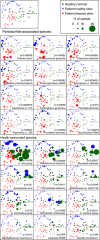
PCoA plots of the UniFrac distance for samples by disease status. Samples from healthy control subjects and deep and shallow sites from subjects with periodontitis are shown. All plots show the ordination of all the samples. The upper-left panel shows unweighted points, and the lower arrays show points weighted by abundance for the 12 species most strongly associated with periodontitis and health. Empty symbols indicate zero abundance of the species.
Figure 4
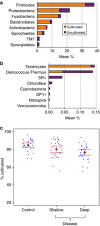
Relative abundance and fraction of sequences mapped to cultivated species. (a) Overall abundance of cultured and uncultured organisms for abundant phyla. (b) Overall abundance of cultured and uncultured organisms for rare phyla. (c) Percentage of cultivated species by sample type. More uncultivated sequences were observed in disease samples (panel c, P<0.05 for all post hoc paired tests). Overall 81% of sequences mapped to cultivated species.
Figure 5
Gram status by disease status. A small but significant shift to more gram-negative status in periodontitis is seen in this scatter plot with means and 95% CI.
Figure 6
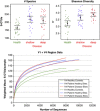
Diversity in periodontitis and health. Mean number of species is greater in subjects with periodontitis (upper-left panel), and Shannon Diversity Index (species evenness) is greatest in deep sites (upper-right panel). Rarefaction curves are shown in the lower panel for V1-2 and V4 sequence data.
Figure 7
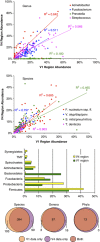
Comparison of community profiles obtained from the V1-2 and V4 variable regions. The top two panels show correlations for highly abundant genera and species. The species abbreviations refer to Fusobacterium nucleatum, subspecies fusiforme, the Veillonella atypical/dispar/parvula group, the Streptococcus mitis/pneumoniae/infantis/oralis group, and Treponema denticola. The bar graph shows abundance or the most prevalent phyla. The bottom panel is a Venn diagram showing the intersection for the two regions at the level of species, genus and phylum. The V1-2 region is referred to as V1 in the graphics.
Similar articles
- Comparison of the oral microbiome of patients with generalized aggressive periodontitis and periodontitis-free subjects.
Schulz S, Porsch M, Grosse I, Hoffmann K, Schaller HG, Reichert S. Schulz S, et al. Arch Oral Biol. 2019 Mar;99:169-176. doi: 10.1016/j.archoralbio.2019.01.015. Epub 2019 Jan 28. Arch Oral Biol. 2019. PMID: 30710838 - Comparative Analyses of Subgingival Microbiome in Chronic Periodontitis Patients with and Without IgA Nephropathy by High Throughput 16S rRNA Sequencing.
Cao Y, Qiao M, Tian Z, Yu Y, Xu B, Lao W, Ma X, Li W. Cao Y, et al. Cell Physiol Biochem. 2018;47(2):774-783. doi: 10.1159/000490029. Epub 2018 May 22. Cell Physiol Biochem. 2018. PMID: 29807361 - In-depth snapshot of the equine subgingival microbiome.
Gao W, Chan Y, You M, Lacap-Bugler DC, Leung WK, Watt RM. Gao W, et al. Microb Pathog. 2016 May;94:76-89. doi: 10.1016/j.micpath.2015.11.002. Epub 2015 Nov 10. Microb Pathog. 2016. PMID: 26550763 - Japanese subgingival microbiota in health vs disease and their roles in predicted functions associated with periodontitis.
Ikeda E, Shiba T, Ikeda Y, Suda W, Nakasato A, Takeuchi Y, Azuma M, Hattori M, Izumi Y. Ikeda E, et al. Odontology. 2020 Apr;108(2):280-291. doi: 10.1007/s10266-019-00452-4. Epub 2019 Sep 9. Odontology. 2020. PMID: 31502122 - Profiling of Oral Bacterial Communities.
Wade WG, Prosdocimi EM. Wade WG, et al. J Dent Res. 2020 Jun;99(6):621-629. doi: 10.1177/0022034520914594. Epub 2020 Apr 14. J Dent Res. 2020. PMID: 32286907 Free PMC article. Review.
Cited by
- Genomic insights into the marine sponge microbiome.
Hentschel U, Piel J, Degnan SM, Taylor MW. Hentschel U, et al. Nat Rev Microbiol. 2012 Sep;10(9):641-54. doi: 10.1038/nrmicro2839. Epub 2012 Jul 30. Nat Rev Microbiol. 2012. PMID: 22842661 Review. - Bacteria associated with periodontal disease are also increased in health.
López-Martínez J, Chueca N, Padial-Molina M, Fernandez-Caballero JA, García F, O'Valle F, Galindo-Moreno P. López-Martínez J, et al. Med Oral Patol Oral Cir Bucal. 2020 Nov 1;25(6):e745-e751. doi: 10.4317/medoral.23766. Med Oral Patol Oral Cir Bucal. 2020. PMID: 32701927 Free PMC article. - Activation of the pattern recognition receptor NOD1 in periodontitis impairs the osteogenic capacity of human periodontal ligament stem cells via p38/MAPK signalling.
He Y, Wu Z, Chen S, Wang J, Zhu L, Xie J, Zhou C, Zou S. He Y, et al. Cell Prolif. 2022 Dec;55(12):e13330. doi: 10.1111/cpr.13330. Epub 2022 Aug 31. Cell Prolif. 2022. PMID: 36043447 Free PMC article. - Metagenomic Characterization and Comparative Analysis of Removable Denture-Wearing and Non-Denture-Wearing Individuals in Healthy and Diseased Periodontal Conditions.
Wong HH, Hung CH, Yip J, Lim TW. Wong HH, et al. Microorganisms. 2024 Jun 13;12(6):1197. doi: 10.3390/microorganisms12061197. Microorganisms. 2024. PMID: 38930579 Free PMC article. - Strain-specific colonization patterns and serum modulation of multi-species oral biofilm development.
Biyikoğlu B, Ricker A, Diaz PI. Biyikoğlu B, et al. Anaerobe. 2012 Aug;18(4):459-70. doi: 10.1016/j.anaerobe.2012.06.003. Epub 2012 Jul 5. Anaerobe. 2012. PMID: 22771792 Free PMC article.
References
- Altschul SF, Gish W, Miller W, Myers EW, Lipman DJ. Basic local alignment search tool. J Mol Biol. 1990;215:403–410. - PubMed
Publication types
MeSH terms
Substances
LinkOut - more resources
Full Text Sources
Other Literature Sources
Research Materials

