C3-dependent mechanism of microglial priming relevant to multiple sclerosis - PubMed (original) (raw)
C3-dependent mechanism of microglial priming relevant to multiple sclerosis
Valeria Ramaglia et al. Proc Natl Acad Sci U S A. 2012.
Abstract
Microglial priming predisposes the brain to neurodegeneration and affects disease progression. The signal to switch from the quiescent to the primed state is unknown. We show that deleting the C3 convertase regulator complement receptor 1-related protein y (Crry) induces microglial priming. Mice that were double-knockout for Crry and either C3 or factor B did not show priming, demonstrating dependence on alternative pathway activation. Colocalization of C3b/iC3b and CR3 implicated the CR3/iC3b interaction in priming. Systemic lipopolysaccharide challenge overactivated primed microglia with florid expression of proinflammatory molecules, which were blocked by complement inhibition. Relevance for neurodegenerative disease is exemplified by human multiple sclerosis (MS) and by experimental autoimmune encephalomyelitis (EAE), a model of MS. In human MS, microglial priming was evident in perilesional white matter, in close proximity to C3b/iC3b deposits. EAE was accelerated and exacerbated in Crry-deficient mice, and was dependent on C activation. In summary, C3-dependent microglial priming confers susceptibility to other challenges. Our observations are relevant to progression in MS and other neurological diseases exacerbated by acute insults.
Conflict of interest statement
Conflict of interest statement: V.R. and F.B. are shareholders of Regenesance BV, a biopharmaceutical spin-off company that develops therapeutics that affect complement activation.
Figures
Fig. 1.
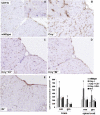
Alternative pathway-dependent microglial phenotype in Crry−/− spinal cord. (A_–_E) CD11b immunostaining in spinal cord of WT (A and Inset), Crry−/− (B and Inset), Crry−/−C3−/− (C), Crry−/−fB−/− (D), and fH−/− mice (E). (F) Quantification of CD11b immunostaining in brain and spinal cord of WT (n = 7), Crry−/− (n = 7), Crry−/−C3−/− (n = 3), Crry−/−fB−/− (n = 3), and fH−/− mice (n = 4). Values are given as means ± SD. Error bars are for n, number of animals. *P < 0.001 determined by one-way ANOVA. wm, white matter; gm, gray matter. (Scale bar: A_–_E, 100 μm; Insets, 50 μm.)
Fig. 2.
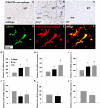
Alternative pathway activation in Crry−/− spinal cord. (A_–_C) Immunostaining for C3b/iC3b neoepitope, showing deposition in Crry−/− (B) but not in WT (A) or fH−/− (C) spinal cords. (D_–_F) Colocalization of C3b/iC3b with the microglial marker CD11b in Crry−/− mice. (Scale bar: A_–_C, 100 μm; D_–_F, 10 μm.) (G_–_L) Relative C3 (G), fB (H), fD (I), DAF (J), fH (K), and Crry (L) mRNA expression in spinal cords of WT (n = 7), Crry−/− (n = 7), and fH−/− (n = 4) mice. Values are normalized to the expression of β-actin and given as percentage (means ± SD) of WT control levels. Error bars are for n, number of animals. *P < 0.05 determined by one-way ANOVA.
Fig. 3.
Spinal cord expression of inflammatory mediators is up-regulated in Crry−/− mice after systemic LPS challenge. (A_–_F) Relative mRNA expression of IL-1β (A), TNF-α (B), IL-6 (C), Cox-2 (D), TGF-β1 (E), and iNOS (F) in spinal cords of WT and Crry−/− mice before (−LPS; WT n = 3; Crry−/− n = 4) and after (+LPS; WT n = 5; Crry−/− n = 8) systemic challenge with LPS. Some groups were pretreated at 12 h earlier with sCR1 (+sCR1; WT n = 4; Crry−/− n = 4) or PBS (+PBS; WT n = 3; Crry−/− n = 3). Values are normalized to expression of β-actin and given as percentage (means ± SD) of WT controls. Asterisks indicate statistically significant differences determined by one-way ANOVA. Error bars are for n, number of animals. (G_–_J) Immunohistochemical staining for IL-1β. IL-1β microglial immunoreactivity is indicated by arrows. (Scale bar: G_–_J, 50 μm.) (K) Western blot analysis of plasma from Crry−/− mice before and after systemic treatment with one dose (20 mg/kg) of sCR1. Plasma from WT and untreated Crry−/− mice is included as additional controls. C3 intact α-chain is shown (arrow). (L) Densitometry of Western blot analysis. Values are expressed as mean ± SD of the integrated optical density (IOD) for the immunoreactive band. Error bars are for n, number of animals. Asterisks indicate statistically significant differences determined by one-way ANOVA.
Fig. 4.
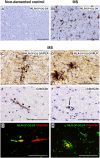
Microglial morphology and C3b/iC3b immunoreactivity in normal-appearing MS tissue. (A and B) Immunostaining for the HLA-DP-DQ-DR microglial marker showing increased immunoreactivity and thick, ramified microglial morphology in normal-appearing MS tissue (B) compared with control white matter (A). (C) A cluster of thickly ramified microglial cells (in black) on a proteolipid protein (PLP)-positive nerve fiber (in light brown) in normal-appearing tissue surrounding an MS lesion. (D) Transverse view of a microglial cluster (in black) showing thick microglial ramifications around a central core. (E) A C3b/iC3b-positive segment of nerve fiber located in intact MS tissue. (F) Transverse view of E. (G and H) Double-immunostaining for HLA-DP-DQ-DR (green) and C3b/iC3b (red) in intact MS tissue showing partial colocalization (in yellow), suggesting discrete areas of contact between the C3b/iC3b localized on the nerve fiber and the HLA-DP-DQ-DR microglial marker.
Fig. 5.
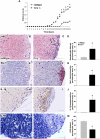
Induction and characterization of EAE in Crry−/− mice. (A) Clinical disease score for EAE, showing earlier onset and increased disease severity in Crry−/− mice (n = 6) compared with WT (n = 4). All animals were killed by day 21. Values are expressed as mean ± SD. Error bars are for n, number of animals. *P < 0.05 determined by Mann–Whitney U nonparametric test. (B_–_M) Inflammation and myelin loss were assessed by H&E staining (B_–_D), Iba-1 immunostaining of macrophages (E_–_G), and IL-1β immunostaining (H_–_J) and LFB staining (K_–_M) of myelin in WT (B, E, H, and K) and Crry−/− (C, F, I, and L) EAE spinal cords. Perivascular infiltration, Iba-1–positive microglia/macrophages, IL-1β deposition, and demyelination were evident in Crry−/− spinal cords (arrows in C). Arrowheads in K and L indicate a blood vessel. (Scale bars: 100 μm.) Quantification of perivascular infiltration (D), Iba-1 staining (G), IL-1β deposition (J), and perivascular LFB staining (M) in Crry−/− mice compared with WT. Values are expressed as mean ± SD. Error bars are for n, number of animals. *P < 0.05 in D and M; *P < 0.01 in G and J; determined by two-tailed Student's t test.
Fig. 6.
Model of microglial priming. In the normal situation, a peripheral event, such as an infection, is the first hit to the brain (via mechanisms yet to be defined and discussed in the text), activating resting microglia to produce inflammatory mediators affecting neuronal function and producing sickness behavior or delirium. In pathological situations such as MS, a first hit (disease) primes microglia for overactivation in response to a second hit. In normal-appearing brain tissue, accumulation of C3b/iC3b on microglia, either secondary to preexisting neurodegeneration or caused by a primary (possibly genetic) dysregulation of C3 activation, is the first hit that primes microglial cells. Under these circumstances, a peripheral injurious event, such as an infection, is the second hit to the brain that overactivates primed microglia to produce an elevated amount of inflammatory mediators, determining severe sickness behavior and prolonged delirium leading to disease progression.
Comment in
- Neurodegenerative disorders: Microglia get ready, set...
Lewis S. Lewis S. Nat Rev Neurosci. 2012 Jan 25;13(3):154-5. doi: 10.1038/nrn3189. Nat Rev Neurosci. 2012. PMID: 22273810 No abstract available.
Similar articles
- Targeted Complement Inhibition at Synapses Prevents Microglial Synaptic Engulfment and Synapse Loss in Demyelinating Disease.
Werneburg S, Jung J, Kunjamma RB, Ha SK, Luciano NJ, Willis CM, Gao G, Biscola NP, Havton LA, Crocker SJ, Popko B, Reich DS, Schafer DP. Werneburg S, et al. Immunity. 2020 Jan 14;52(1):167-182.e7. doi: 10.1016/j.immuni.2019.12.004. Epub 2019 Dec 26. Immunity. 2020. PMID: 31883839 Free PMC article. - Preimplantation embryos cooperate with oviductal cells to produce embryotrophic inactivated complement-3b.
Tse PK, Lee YL, Chow WN, Luk JM, Lee KF, Yeung WS. Tse PK, et al. Endocrinology. 2008 Mar;149(3):1268-76. doi: 10.1210/en.2007-1277. Epub 2007 Nov 26. Endocrinology. 2008. PMID: 18039777 - Deletion of Crry and DAF on murine platelets stimulates thrombopoiesis and increases factor H-dependent resistance of peripheral platelets to complement attack.
Barata L, Miwa T, Sato S, Kim D, Mohammed I, Song WC. Barata L, et al. J Immunol. 2013 Mar 15;190(6):2886-95. doi: 10.4049/jimmunol.1202536. Epub 2013 Feb 6. J Immunol. 2013. PMID: 23390291 Free PMC article. - Role of macrophages/microglia in multiple sclerosis and experimental allergic encephalomyelitis.
Benveniste EN. Benveniste EN. J Mol Med (Berl). 1997 Mar;75(3):165-73. doi: 10.1007/s001090050101. J Mol Med (Berl). 1997. PMID: 9106073 Review. - Immune (dys)regulation in multiple sclerosis: role of the CD95-CD95 ligand system.
Zipp F, Krammer PH, Weller M. Zipp F, et al. Immunol Today. 1999 Dec;20(12):550-4. doi: 10.1016/s0167-5699(99)01545-5. Immunol Today. 1999. PMID: 10562705 Review. No abstract available.
Cited by
- Acute phase proteins are major clients for the chaperone action of α₂-macroglobulin in human plasma.
Wyatt AR, Zammit NW, Wilson MR. Wyatt AR, et al. Cell Stress Chaperones. 2013 Mar;18(2):161-70. doi: 10.1007/s12192-012-0365-z. Epub 2012 Aug 16. Cell Stress Chaperones. 2013. PMID: 22896034 Free PMC article. - Free complement and complement containing extracellular vesicles as potential biomarkers for neuroinflammatory and neurodegenerative disorders.
Burgelman M, Dujardin P, Vandendriessche C, Vandenbroucke RE. Burgelman M, et al. Front Immunol. 2023 Jan 20;13:1055050. doi: 10.3389/fimmu.2022.1055050. eCollection 2022. Front Immunol. 2023. PMID: 36741417 Free PMC article. Review. - Non-canonical B cell functions in transplantation.
Platt JL, Cascalho M. Platt JL, et al. Hum Immunol. 2019 Jun;80(6):363-377. doi: 10.1016/j.humimm.2019.04.006. Epub 2019 Apr 10. Hum Immunol. 2019. PMID: 30980861 Free PMC article. Review. - Myelinosome formation represents an early stage of oligodendrocyte damage in multiple sclerosis and its animal model.
Romanelli E, Merkler D, Mezydlo A, Weil MT, Weber MS, Nikić I, Potz S, Meinl E, Matznick FE, Kreutzfeldt M, Ghanem A, Conzelmann KK, Metz I, Brück W, Routh M, Simons M, Bishop D, Misgeld T, Kerschensteiner M. Romanelli E, et al. Nat Commun. 2016 Nov 16;7:13275. doi: 10.1038/ncomms13275. Nat Commun. 2016. PMID: 27848954 Free PMC article. - The Immunometabolic Gene N-Acetylglucosamine Kinase Is Uniquely Involved in the Heritability of Multiple Sclerosis Severity.
Nataf S, Guillen M, Pays L. Nataf S, et al. Int J Mol Sci. 2024 Mar 28;25(7):3803. doi: 10.3390/ijms25073803. Int J Mol Sci. 2024. PMID: 38612613 Free PMC article.
References
- Sly LM, et al. Endogenous brain cytokine mRNA and inflammatory responses to lipopolysaccharide are elevated in the Tg2576 transgenic mouse model of Alzheimer's disease. Brain Res Bull. 2001;56:581–588. - PubMed
Publication types
MeSH terms
Substances
Grants and funding
- 084542/WT_/Wellcome Trust/United Kingdom
- G0700102/MRC_/Medical Research Council/United Kingdom
- 2 R01 AI041592-13A1/AI/NIAID NIH HHS/United States
- 068590/WT_/Wellcome Trust/United Kingdom
- R01 AI041592/AI/NIAID NIH HHS/United States
LinkOut - more resources
Full Text Sources
Medical
Molecular Biology Databases
Miscellaneous


