Inhibitors of hypoxia-inducible factor 1 block breast cancer metastatic niche formation and lung metastasis - PubMed (original) (raw)
Inhibitors of hypoxia-inducible factor 1 block breast cancer metastatic niche formation and lung metastasis
Carmen Chak-Lui Wong et al. J Mol Med (Berl). 2012 Jul.
Abstract
Intratumoral hypoxia, a frequent finding in metastatic cancer, results in the activation of hypoxia-inducible factors (HIFs). HIFs are implicated in many steps of breast cancer metastasis, including metastatic niche formation through increased expression of lysyl oxidase (LOX) and lysyl oxidase-like (LOXL) proteins, enzymes that remodel collagen at the metastatic site and recruit bone marrow-derived cells (BMDCs) to the metastatic niche. We investigated the effect of two chemically and mechanistically distinct HIF inhibitors, digoxin and acriflavine, on breast cancer metastatic niche formation. Both drugs blocked the hypoxia-induced expression of LOX and LOXL proteins, collagen cross-linking, CD11b⁺ BMDC recruitment, and lung metastasis in an orthotopic breast cancer model. Patients with HIF-1 α-overexpressing breast cancers are at increased risk of metastasis and mortality and our results suggest that such patients may benefit from aggressive therapy that includes a HIF inhibitor.
Conflict of interest statement
Disclosure statement G.L.S. is the C. Michael Armstrong Professor at Johns Hopkins University School of Medicine and an American Cancer Society Research Professor. C.C.W. is a Croucher Foundation Fellow. All authors confirm that there is no conflict of interest associated with this publication.
Figures
Fig. 1
Increased LOXL2 and LOXL4 expression in stromal tissue from invasive breast cancer. Box and whiskers plots of Oncomine data on LOX, LOXL2, and LOXL4 mRNA levels (expressed as the log2 median-centered ratio [17]) in stromal tissues isolated from normal breast (n = 6) and breast cancer (BrCa; n = 53).
Fig. 2
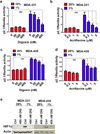
Digoxin and acriflavine inhibit HIF transcriptional activity in breast cancer cells. a–d MDA-231 and MDA-435 cells were co-transfected with HIF-dependent firefly luciferase (p2.1) and control Renilla luciferase (pSV-Renilla) reporter plasmids and cultured for 24 h in the presence of the indicated digoxin or acriflavine concentration at either 20% (red bar) or 1% (blue bar) O2. The ratio of p2.1/pSV-Renilla activity was determined by dual luciferase assays. For the indicated comparisons: ###P < 0.001, **P < 0.01, and ***P < 0.001; one-way ANOVA with Bonferroni correction (mean ± SEM; n = 3). e Immunoblot assays were performed to analyze HIF-1〈 and β-actin protein levels in whole cell lysates prepared from control and digoxin-treated MDA-231 and MDA-435 cells were analyzed by immunoblot assays.
Fig. 3
HIF inhibitors block hypoxia-induced expression of LOX, LOXL2, and LOXL4. Human breast cancer cells were treated with digoxin or acriflavine and exposed to 20% or 1% O2 for 24 or 48 h prior to mRNA or protein analysis, respectively. a Left: LOX mRNA expression was analyzed in MDA-231 cells treated with the indicated concentration of digoxin by reverse transcription quantitative real-time PCR (RT-qPCR) relative to 18S rRNA and normalized to the result from cells exposed to 20% O2 in the absence of digoxin. Right: LOX and β-actin protein levels were analyzed in MDA-231 cells treated with 100 nM digoxin (+), 400 nM digoxin (++), or vehicle (0.02% DMSO) control (−). b Left: LOXL4 mRNA expression was analyzed in MDA-231 cells treated with the indicated concentration of digoxin. Right: LOXL4 protein levels were analyzed in MDA-231 cells treated with 400 nM digoxin (++) or vehicle control (−). c LOX (left) and LOXL4 (middle) mRNA levels were analyzed in MDA-231 cells treated with the indicated concentration of acriflavine. Right: LOX and LOXL4 protein levels were analyzed in MDA-231 cells treated with 5 µM acriflavine (++) or vehicle control (−). d LOXL2 mRNA expression was analyzed in MDA-435 cells treated with the indicated concentration of digoxin (left) or acriflavine (middle). Right: LOXL2 protein levels were analyzed in MDA-435 cells treated with 5 µM acriflavine (++), 400 nM digoxin (++), or vehicle control (−). ###P < 0.001 vs 20% O2 control; *P < 0.05, **P < 0.01, and ***P < 0.001 vs 1% O2 control, one-way ANOVA with Bonferroni correction (mean ± SEM; n = 3).
Fig. 4
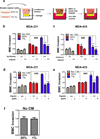
HIF inhibitors suppress breast cancer-mediated bone marrow cell (BMC) invasion. a Transwell chambers were coated with matrigel. Conditioned medium (CM) from breast cancer cells was incubated with matrigel for 16 h at 37°C. BMCs in serum-free medium were seeded in the top chamber. Fresh medium containing 10% FBS was placed in the bottom chamber. The number of BMCs that invaded through the pretreated matrigel to the bottom chamber was counted. The results were normalized to those obtained using CM from cells exposed to 20% O2 in the absence of HIF inhibitor (acriflavine or digoxin). b–c Analysis of CM from MDA-231 cells or MDA-435 cells, which were treated with 5 µM acriflavine (++), 400 nM (++) digoxin, or vehicle (−) and cultured in 20% (red bar) or 1% (blue bar) O2 for 48 h. d–e Analysis of CM from MDA-231 or MDA-435 cells, which were treated with 200 µM βAPN, 400 nM digoxin, or vehicle and cultured in 20% or 1% O2 for 48 h. Blank (fresh) medium and drug-containing blank medium were included as controls (gray bars). f Blank medium incubated at 20% O2 or 1% O2 was incubated with matrigel prior to BMC invasion assay. For the indicated comparisons: ###P < 0.001 and ***P <l 0.001, one-way ANOVA with Bonferroni correction (mean ± SEM; n = 3).
Fig. 5
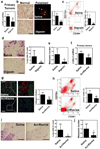
Treatment with digoxin blocks metastatic niche formation in the lungs of MDA-231 tumor-bearing mice. SCID mice received mammary fat pad (MFP) injections of MDA-231 cells followed by intraperitoneal (IP) injection of saline or digoxin (2 mg/kg/day) starting 14 days after MFP injection. Primary tumors and lungs were harvested 47 days after orthotopic implantation. a LOX (black bar) and LOXL4 (gray bar) mRNA levels in the primary tumors were determined by RT-qPCR. Values were normalized to saline control. b Lung sections (scale bar = 100 µm) were treated with Picrosirius Red, which selectively stains cross-linked (fibrillar) collagen when viewed under circularly polarized light (arrow). The number of collagen fibers per field was counted in 5 fields per section and normalized to the result obtained from the saline treated mice. c Single cell suspensions from lung were analyzed by flow cytometry to quantify CD11b+CD45+ cells (percentage of total cell population analyzed). d Lung sections (scale bar = 100 µm) were analyzed by immunohistochemistry using an antibody against CD11b. CD11b+ cell clusters was counted in at least 5 random fields per section and the mean ± SD value for cell clusters per field was determined. *P < 0.05 and **P < 0.01 vs saline, Student’s t-test (n = 5 mice).
Fig. 6
Treatment with digoxin or acriflavine blocks metastatic niche formation and breast cancer metastasis in the lungs in MDA-435 tumor-bearing mice. a–e SCID mice received MFP injection of MDA-435 cells followed by IP injection of saline or digoxin (2 mg/kg/day), starting 8 days after implantation. 42 days after MFP injection, lungs and primary tumors were harvested. a LOXL2 mRNA levels in the primary tumors were determined by RT-qPCR. Values were normalized to saline control (mean ± SD; n = 5). b Picrosirius Red staining under polarized light (scale bar = 100 µm), c flow cytometry analysis of CD11b+CD45+ cells (% of total cell population analyzed), and d lung metastases (% of total lung area, H&E staining, scale bar = 1 mm) are shown. e Metastatic burden was determined by isolation of lung DNA and qPCR using human-specific HK2 gene primers and mouse 18S rDNA primers; the ratio was normalized to the result obtained from saline control (mean ± SD; n = 5). f–j NOD-SCID mice received MFP injection of MDA-435 cells followed by IP injection of saline or acriflavine (4 mg/kg/day) starting 8 days after orthotopic implantation. Lungs and tumors were harvested 45 days after implantation. f LOXL2 mRNA expression in primary tumors was determined by RT-qPCR and normalized to saline control. Cross-linking of collagen was visualized with Picrosirius Red staining under polarized light (g; scale bar = 100 µm). Flow cytometry analysis of CD11b+CD45+ BMDCs in lungs (h), H&E staining (scale bar = 1 mm) of lung metastases (i; % of total lung area), and qPCR analysis of metastatic burden in lungs (j) from saline and acriflavine treated mice are shown. *P < 0.05 and **P < 0.01 vs saline, Student’s t-test (mean ± SD; n = 3–5).
Fig. 7
BMCs facilitate migration and invasion of breast cancer cells. a Medium with (+) or without (+) BMCs (green in schematic at left) was added to the top chamber and incubated with matrigel-coated filter inserts at 37°C for 16 h. The BMCs were removed and MDA-231 cells (blue in schematic) were seeded in the top chamber with medium containing 10% FBS in the bottom chamber. Representative photomicrographs of invaded cells stained with crystal violet are shown (middle panels; scale bar = 250 µm) and mean + SEM data are shown (bar graph at right). b–c Medium with (+) or without (−) BMCs was seeded in the bottom chamber. MDA-231 cells in serum-free medium were seeded in the top chamber containing a non-coated filter (Migration assay; b) or matrigel-coated filter (Invasion assay; c). Representative photomicrographs of crystal violet-stained cells are shown (scale bar = 100 µm). The number of migrated or invaded cells was counted in a blinded fashion in at least 3 random fields, the data were normalized to the results obtained from medium without BMCs, and mean + SEM (n = 3) are shown (bar graph at right). *P < 0.05, **P < 0.01, and ***P < 0.001 vs medium without BMCs, Student’s t-test.
Fig. 8
Analysis of conditioned media from breast cancer cells treated with digoxin or acriflavine. Matrigel-coated inserts were incubated with CM from MDA-231 (a) or MDA-435 cells (b) that were treated with vehicle (−), 400 nM digoxin (++), or 5 µM acriflavine (++) and exposed to 20% or 1% O2. Naïve MDA-231 cells were seeded in the top chamber. Cells that invaded through the pretreated matrigel were fixed, stained with crystal violet, and counted. Representative photomicrographs of invaded cells are shown (panels at left; scale bar = 200 µm). The number of invaded cells was counted, normalized to the control (Ctrl; 20% O2, no drug), and mean ± SEM (n = 3) values (bar graph at right) are shown. For the indicated comparisons: ###P < 0.001, **P < 0.01, and ***P < 0.001; one-way ANOVA with Bonferroni correction.
Similar articles
- Hypoxia-inducible factor 1 is a master regulator of breast cancer metastatic niche formation.
Wong CC, Gilkes DM, Zhang H, Chen J, Wei H, Chaturvedi P, Fraley SI, Wong CM, Khoo US, Ng IO, Wirtz D, Semenza GL. Wong CC, et al. Proc Natl Acad Sci U S A. 2011 Sep 27;108(39):16369-74. doi: 10.1073/pnas.1113483108. Epub 2011 Sep 12. Proc Natl Acad Sci U S A. 2011. PMID: 21911388 Free PMC article. - Hypoxia-induced lysyl oxidase is a critical mediator of bone marrow cell recruitment to form the premetastatic niche.
Erler JT, Bennewith KL, Cox TR, Lang G, Bird D, Koong A, Le QT, Giaccia AJ. Erler JT, et al. Cancer Cell. 2009 Jan 6;15(1):35-44. doi: 10.1016/j.ccr.2008.11.012. Cancer Cell. 2009. PMID: 19111879 Free PMC article. - Cancer-stromal cell interactions mediated by hypoxia-inducible factors promote angiogenesis, lymphangiogenesis, and metastasis.
Semenza GL. Semenza GL. Oncogene. 2013 Aug 29;32(35):4057-63. doi: 10.1038/onc.2012.578. Epub 2012 Dec 10. Oncogene. 2013. PMID: 23222717 Free PMC article. Review. - Molecular mechanisms mediating metastasis of hypoxic breast cancer cells.
Semenza GL. Semenza GL. Trends Mol Med. 2012 Sep;18(9):534-43. doi: 10.1016/j.molmed.2012.08.001. Epub 2012 Aug 23. Trends Mol Med. 2012. PMID: 22921864 Free PMC article. Review.
Cited by
- Lysyl Oxidase as a Serum Biomarker of Liver Fibrosis in Patients with Severe Obesity and Obstructive Sleep Apnea.
Mesarwi OA, Shin MK, Drager LF, Bevans-Fonti S, Jun JC, Putcha N, Torbenson MS, Pedrosa RP, Lorenzi-Filho G, Steele KE, Schweitzer MA, Magnuson TH, Lidor AO, Schwartz AR, Polotsky VY. Mesarwi OA, et al. Sleep. 2015 Oct 1;38(10):1583-91. doi: 10.5665/sleep.5052. Sleep. 2015. PMID: 26085300 Free PMC article. - Hypoxia-inducible factor 1 transcriptional activity in endothelial cells is required for acute phase cardioprotection induced by ischemic preconditioning.
Sarkar K, Cai Z, Gupta R, Parajuli N, Fox-Talbot K, Darshan MS, Gonzalez FJ, Semenza GL. Sarkar K, et al. Proc Natl Acad Sci U S A. 2012 Jun 26;109(26):10504-9. doi: 10.1073/pnas.1208314109. Epub 2012 Jun 13. Proc Natl Acad Sci U S A. 2012. PMID: 22699503 Free PMC article. - Pre-treatment of mice with tumor-conditioned media accelerates metastasis to lymph nodes and lungs: a new spontaneous breast cancer metastasis model.
Lee E, Pandey NB, Popel AS. Lee E, et al. Clin Exp Metastasis. 2014 Jan;31(1):67-79. doi: 10.1007/s10585-013-9610-9. Epub 2013 Aug 21. Clin Exp Metastasis. 2014. PMID: 23963763 Free PMC article. - The possibilities of LOXL4 as a prognostic marker for carcinomas.
Wang J, Chen C, Huang J, Xie Z, Chen X, Zheng Z, Li E, Zou H. Wang J, et al. Amino Acids. 2023 Nov;55(11):1519-1529. doi: 10.1007/s00726-023-03343-9. Epub 2023 Oct 9. Amino Acids. 2023. PMID: 37814029 Review. - Epithelial-mesenchymal transition: a new target in anticancer drug discovery.
Marcucci F, Stassi G, De Maria R. Marcucci F, et al. Nat Rev Drug Discov. 2016 May;15(5):311-25. doi: 10.1038/nrd.2015.13. Epub 2016 Jan 29. Nat Rev Drug Discov. 2016. PMID: 26822829
References
- Weigelt B, Peterse JL, van't Veer LJ. Breast cancer metastasis: markers and models. Nat Rev Cancer. 2005;5:591–602. - PubMed
- Vaupel P, Mayer A, Hockel M. Tumor hypoxia and malignant progression. Methods Enzymol. 2004;381:335–354. - PubMed
- Erler JT, Bennewith KL, Nicolau M, Dornhofer N, Kong C, Le QT, Chi JT, Jeffrey SS, Giaccia AJ. Lysyl oxidase is essential for hypoxia-induced metastasis. Nature. 2006;440:1222–1226. - PubMed
Publication types
MeSH terms
Substances
LinkOut - more resources
Full Text Sources
Other Literature Sources
Medical
Research Materials


