Two PI 3-kinases and one PI 3-phosphatase together establish the cyclic waves of phagosomal PtdIns(3)P critical for the degradation of apoptotic cells - PubMed (original) (raw)
Two PI 3-kinases and one PI 3-phosphatase together establish the cyclic waves of phagosomal PtdIns(3)P critical for the degradation of apoptotic cells
Nan Lu et al. PLoS Biol. 2012 Jan.
Abstract
Phosphatidylinositol 3-phosphate (PtdIns(3)P) is a signaling molecule important for many membrane trafficking events, including phagosome maturation. The level of PtdIns(3)P on phagosomes oscillates in two waves during phagosome maturation. However, the physiological significance of such oscillation remains unknown. Currently, the Class III PI 3-kinase (PI3K) Vps34 is regarded as the only kinase that produces PtdIns(3)P in phagosomal membranes. We report here that, in the nematode C. elegans, the Class II PI3K PIKI-1 plays a novel and crucial role in producing phagosomal PtdIns(3)P. PIKI-1 is recruited to extending pseudopods and nascent phagosomes prior to the appearance of PtdIns(3)P in a manner dependent on the large GTPase dynamin (DYN-1). PIKI-1 and VPS-34 act in sequence to provide overlapping pools of PtdIns(3)P on phagosomes. Inactivating both piki-1 and vps-34 completely abolishes the production of phagosomal PtdIns(3)P and disables phagosomes from recruiting multiple essential maturation factors, resulting in a complete arrest of apoptotic-cell degradation. We have further identified MTM-1, a PI 3-phosphatase that antagonizes the activities of PIKI-1 and VPS-34 by down-regulating PtdIns(3)P on phagosomes. Remarkably, persistent appearance of phagosomal PtdIns(3)P, as a result of inactivating mtm-1, blocks phagosome maturation. Our findings demonstrate that the proper oscillation pattern of PtdIns(3)P on phagosomes, programmed by the coordinated activities of two PI3Ks and one PI 3-phosphatase, is critical for phagosome maturation. They further shed light on how the temporally controlled reversible phosphorylation of phosphoinositides regulates the progression of multi-step cellular events.
Conflict of interest statement
The authors have declared that no competing interests exist.
Figures
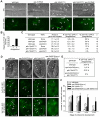
Figure 1. VPS-34 and PIKI-1 act together to produce a robust amount of PtdIns(3)P on phagosomes and drive the degradation of apoptotic cells.
(A–C) Wild-type and mutant adult hermaphrodites analyzed here all carried P_ced-1_2xFYVE_::gfp_ expressed in gonadal sheath cells and were analyzed 48 h after the mid-L4 stage. RNAi treatments were started at L4 stage. (A) DIC (a–d) and epifluorescence images (e–h) of gonad arms of wild-type or mutant adult hermaphrodites. Dorsal is to the top. Arrows and arrowheads indicate 2xFYVE::GFP(+) and 2xFYVE::GFP(−) phagosomes, respectively. Open arrowheads in (g) indicate one 2xFYVE::GFP(−) and one 2xFYVE::GFP(+) phagosome, whose relative GFP signal intensities were shown in (B). Scale bars, 20 µm. (B) The ratio of GFP intensity on phagosomal surface/GFP intensity in the cytosol of the engulfing cell of the two phagosomes marked with open arrowheads in A(g). (C) The numbers of germ cell corpses per gonadal arm and percentage of 2xFYVE(+) phagosomes. vps-34(N) and vps-34(C) are two independent RNAi feeding constructs targeting different regions of vps-34 coding sequence. Data are presented as mean ± standard deviation (SD). n, number of animals scored. (D–F) “vps-34(m − z −)” indicates the genotype of embryos in which both the maternal and zygotic products of vps-34 were inactivated. (D) DIC (a–d) and epifluorescent images (e–l) of 2-fold stage embryos expressing P_ced-1_2xFYVE_::gfp_. Genotypes are indicated on top of the images. (e–h) Single z-sections (section number labeled) of GFP images that correspond to the DIC images in (a–d). (i–l) 2-D projections of 45 serial z_-sections (at 0.5 µm intervals) of GFP images that span the entire depth of the embryos shown in (a–h). Filled arrows and arrowheads indicate 2xFYVE::GFP(+) and 2xFYVE::GFP(−) cell corpses, respectively. Open arrowheads indicate PtdIns(3)P(+) endosomes. Open arrows indicate nuclei that were labeled by 2xFYVE::GFP. Scale bars, 10 µm. (E) The Percentage of 2xFYVE::GFP(+) phagosomes in 2-fold stage embryos carrying P_ced-1_2xFYVE::gfp_. At least 200 phagosomes were scored for each genotype. (F) The numbers of somatic cell corpses in embryos at different stages with indicated genotypes. These embryos did not carry P_ced-1_2xFYVE_::gfp_. At least 20 animals were scored for each data point. Data are presented as mean ± SD. * p<0.05 and **p<0.001 calculated by independent Student's _t_-test.
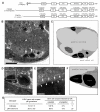
Figure 2. In the gonad of piki-1(tm3171) mutants, apoptotic germ cells are engulfed but fail to be degraded.
(A) Domain structure of PIKI-1 and its orthologs in other species. Percentage indicates amino acid identity (similarity in parentheses) of each domain between PIKI-1 and its orthologs; UIM, ubiquitin-interacting motif; RBD, Ras-binding domain; C2, protein kinase C conserved region 2; PIK, phosphoinositide 3-kinase, accessory domain; Kinase, phosphoinositide 3-kinase, catalytic domain; PX, PhoX homologous domain. (B–C) A cross-section transmission electron microscopy (TEM) image of a distal gonad arm in a piki-1(tm3171) adult hermaphrodite (B) and its corresponding traces of membranes (C). Cell identities are labeled. White arrows in (B) indicate two engulfed cell corpses. The black arrow in (C) indicates a gonadal sheath cell. Scale bar: 5 µm. (D–F) Enlarged images of germ cell corpses indicated by arrows in (B) and their surrounding environment inside a sheath cell are displayed in (E). (F) Schematic diagram of (D). (E) Further enlarged image of the framed region in (D). White arrows and arrowheads mark the plasma membranes of gonadal sheath cells and germ cell corpses, respectively. Scale bars: 2 µm in (D); 0.5 µm in (E). (G) Percentage of engulfed and unengulfed germ cell corpses quantified by TEM. Data of wild-type animal are from . n, number of germ cell corpses analyzed.
Figure 3. PtdIns(3)P is required for recruiting SNX-1 and LST-4 to the surface of phagosomes.
GFP reporters are expressed in the engulfing cells under the control of P_ced-1_. (A–B) Time-lapse images showing the dynamic recruitment of SNX-1::GFP (A) or LST-4::GFP (B) onto C3 phagosomes in wild-type embryos or the lack of recruitment in vps-34(h510)(m − z −); piki-1(tm3171) embryos. “0 min” represents the time point when engulfment is just completed. Scale bars, 2 µm. (C) DIC and GFP images of wild-type and piki-1(tm3171) mutant adult hermaphrodite gonads expressing SNX-1::GFP in gonadal sheath cells. Arrows and arrowheads indicated phagosomes labeled or not labeled with SNX-1::GFP, respectively. Scale bars, 20 µm. (D) The number of germ cell corpses and percentage of SNX-1::GFP(+) phagosomes in adult hermaphrodites at 48 h after L4 stage. Data are presented as mean ± standard deviation (SD). Fifteen animals were scored for each sample.
Figure 4. Inactivation of PIKI-1 impairs the recruitment of RAB-5, RAB-2, and RAB-7 to phagosomal surfaces. In addition, RAB-5, but not RAB-2 or RAB-7, is required for the production of PtdIns(3)P on phagosomes.
(A–C) DIC and GFP images of gonads of adult hermaphrodite with various genotypes expressing GFP::RAB-5 (A), GFP::UNC-108/RAB-2 (B), or GFP::RAB-7 (C) in the gonadal sheath cells. Animals were analyzed at 48 h after L4 stage. Arrows and arrowheads indicated phagosomes labeled or not labeled with enriched GFP reporter, respectively. Dorsal is to the top. Scale bars, 20 µm. (D) Percentage of phagosomes labeled with various GFP reporters in adult hermaphrodites at 48 h post-L4 stage. Data are presented as mean ± SD. Fifteen animals were scored for each sample. * p<0.001 measured by independent Student's _t_-test. (E) The percentage of 2xFYVE::GFP-labeled phagosomes in _rab-5_(RNAi), _rab-2(n3263)_, or _rab-7(ok511)_ mutant adult hermaphrodites at 48 h after L4 stages. 15 animals were analyzed for each data point. Data are presented as mean ± SD. * _p_<0.001, independent Student's _t_-test. “NS” indicates non-significant differences (_p_>0.05, independent Student's _t_-test). Images are shown in Figure S4.
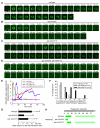
Figure 5. VPS-34 and PIKI-1 produce PtdIns(3)P on phagosomes in differential temporal patterns and, together, are responsible for the total phagosomal PtdIns(3)P production activity.
(A–D) Serial time-lapse images displaying the normal or abnormal temporal presentation pattern of PtdIns(3)P on the C3 phagosome during phagosome maturation in wild-type (A), vps-34(h510)(m − z −) (B), or piki-1(tm3171) (C) single mutant embryos, or the lack of phagosomal PtdIns(3)P production in a piki-1(tm3171); vps-34(h510)(m − z −) double mutant embryo (D). All embryos expressed P_ced-1_ 2xFYVE_::gfp_. “0 min” represents the time point when C3 was just engulfed. Scale bars, 2 µm. (E) The relative PtdIns(3)P signal intensity, represented as the ratio of PtnIns(3)P signal intensity on the surface of phagosomes to that in the nearby cytoplasm of the host cell, measured from images in (A–D) and plotted over time. (F) Histogram distribution of the time interval between the completion of engulfment and the initial appearance of PtdIns(3)P on phagosomal surfaces, deduced from time-lapse recording of multiple C1, C2, and C3 phagosomes. n, number of phagosomes scored. (G) The average duration of the first wave of PtdIns(3)P on phagosomes. Error bars indicate standard deviation. * p<0.01, independent Student's _t_-test. n, number of phagosomes scored. (H) Diagram summarizing the temporal presentation pattern of PtdIns(3)P on maturing phagosomes in indicated genetic backgrounds. Data represent means obtained from time-lapse recording of multiple C1, C2, and C3 cell corpses, as shown in (E) and (F). The light and dark green colors reflect weak and strong signals, respectively. “0 min” represents the time point when engulfment is just complete.
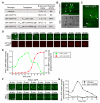
Figure 6. PIKI-1 is recruited onto pseudopods and nascent phagosomes during the removal of apoptotic cells.
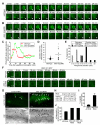
(A) The rescuing activity of wild-type and mutant PIKI-1::GFP expressed under the control of P_ced-1_. The numbers of germ cell corpses in the gonads of adult hermaphrodites carrying particular transgenes were scored at 48 h post-L4 stage. Data are presented as mean ± standard deviation. Fifteen animals were scored for each genotype. Rescuing activity was calculated as [(Nomut−No(mut+transgene))/(Nomut−Nowt)]×100%. No, mean number of germ-cell corpses. (B) Epifluorescence and DIC images of part of the gonad in a wild-type hermaphrodites expressing P_ced-1piki-1::gfp_. Arrows indicate phagosomes labeled with PIKI-1::GFP. Scale bars, 20 µm. (C) An epifluorescence image of the ventral surface of a ∼330-min-stage wild-type embryo expressing P_ced-1 piki-1::gfp_. An arrow indicates a nascent phagosome labeled by PIKI-1::GPF. Two arrowheads mark two cells that clearly display the cytoplasmic localization pattern of PIKI-1::GFP. Scale bars, 5 µm. (D) Time-lapse images showing the recruitment of PIKI-1::GFP to the extending pseudopods and a nascent C3 phagosome, followed by the rapid production of phagosomal PtdIns(3)P in a wild-type embryo expressing P_ced-1 piki-1::gfp_ and P_ced-1 2x_FYVE_::mrfp1_. Arrowheads indicate the extending pseudopods. “0 min” represents the time point when engulfment is just completed. Scale bars, 2 µm. Additional examples are shown in Figure S8. (E) The relative PIKI-1 and PtdIns(3)P signal intensity, represented as the ratio of fluorescent signal intensity on the surface of phagosomes to that in the nearby cytoplasm of the host cell, were measured from images in (D) and plotted over time. (F) Time-lapse images showing dynamic localization of PIKI-1::GFP on the extending pseudopods and the nascent C3 phagosome in a wild-type embryo and the lack of the localization in a dyn-1(n4039) mutant embryo. Scale bar, 2 µm. (G) The relative PIKI-1 signal intensity, represented as the ratio of PIKI-1::GFP signal intensity on the surface of phagosomes to that in the nearby cytoplasm of the host cell, was measured from images in (F) and plotted over time.
Figure 7. MTM-1 promotes the turnover of phagosomal PtdIns(3)P and is essential for phagosome maturation.
(A–B) The temporal presentation patterns of PtdIns(3)P on one C1 phagosome in each of a wild-type (A) or mtm-1(op309) mutant (B) embryo were monitored by 2xFYVE::GFP. “0 min” is when engulfment is completed. Arrows and arrowheads indicate the phagosome maturation stages covered by the first and the second waves of PtdIns(3)P on phagosomes, respectively. Scale bars, 2 µm. Additional examples are shown in Figure S10. (C) Quantification of the relative PtdIns(3)P signal intensity (the ratio of GFP signal intensity on the surface of phagosomes versus in the cytoplasm of the host cell) measured from each image in (A–B) and plotted over time. Additional examples are shown in Figure S10. (D) The time-span of the first PtdIns(3)P wave in multiple C1, C2, and C3 phagosomes were displayed in a scatter plot, represented by individual dots. Horizontal lines indicate the average duration of the first PtdIns(3)P wave in each genotype. (E) Histogram distribution of the phagosome duration in embryos determined using the CED-1C::GFP reporter. Duration was defined as a time span during which the diameter of a phagosome was reduced to one-third of the initial size. The mean duration ± SD of each genotype was stated. n, the number of C1, C2, and C3 phagosomes measured using time-lapse recording. (F) Time-lapse recording of the degradation process of C3 phagosomes (arrowheads) in a wild-type or a mtm-1(op309) mutant embryo expressing P_ced-1 ced-1C::gfp_. “0 min” represents the time point when the C3 cell corpse was just fully engulfed, and the newly formed phagosome was recognizable as a dark sphere inside the GFP-labeled cytoplasm of the host cells. Scale bars, 2 µm. (G–J) mtm-1(RNAi) phenotypes. RNAi treatments started at L1-stage and animals were analyzed at 48 h after L4 stages. mtm-1(N) and mtm-1(C) are two non-overlapping RNAi constructs. (G) Epifluorescence (a and c) and DIC (b and d) images of part of gonad arms of wild-type hermaphrodites expressing P_ced-1_2xFYVE_::gfp_, after treatment with control or mtm-1(C) RNAi. Arrows and arrowheads indicate 2xFYVE::GFP(+) and 2xFYVE::GFP(−) phagosomes, respectively. Dorsal is to the top. Scale bars, 10 µm. (H) The number of germ cell corpses per gonadal arm of wild-type hermaphrodites treated with indicated RNAi. Data were presented as mean ± SD. n, number of animals scored. (I) Percentages of engulfed germ cell corpses were scored using GFP::RAB-7 as a phagosomal marker in ced-5(n1812) mutant and mtm-1(C) RNAi-treated adult hermaphrodites at 48 h post-L4 stage. Data are presented as mean ± SD, obtained from three repeats, each of which scoring 50 phagosomes in the gonad. (J) The percentage of phagosomes labeled with PtdIns(3)P in the gonad of wild-type adult hermaphrodites that expressed P_ced-1_2xFYVE_::gfp_ and were treated with indicated RNAi. Data are presented as mean ± SD, obtained from three repeats, each of which scoring 50 phagosomes in the gonad.
Figure 8. MTM-1 antagonizes the PtdIns(3)P-production activities of PIKI-1 and VPS-34.
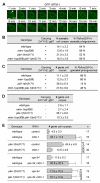
(A) Time-lapse images showing the dynamic recruitment of GFP::MTM-1 to the phagocytic cup (arrowhead) and subsequently the nascent C2 phagosome in a wild-type embryo expressing P_ced-1gfp::mtm-1_. “0 min” represents the time point when engulfment is just completed. Scale bar, 2 µm. (B–C) The numbers of DIC(+) cell corpses and the percentage of 2xFYVE::GFP(+) phagosomes in 2-fold stage embryos (B) or adult hermaphrodites at 48 h after L4 stage (C) that carried transgene P_ced-1 2xFYVE::gfp_. Data are presented as mean ± SD. Fifteen animals were scored for each genotype. (D) The numbers of germ cell corpses in adult hermaphrodites not carrying P_ced-1 2xFYVE::gfp_ at 48 h after L4 stage. Data are presented as mean ± SD. Fifteen animals were scored for each genotype. (E) RNAi inactivation of mtm-1 resulted in severe germ cell corpse removal defect, which was partially rescued by the piki-1(tm3171) mutation or vps-34(RNAi). RNAi treatments started at L1-stage and animals were scored at 48 h after L4 stages for the numbers of germ cell corpses per gonadal arm. The RNAi constructs are vps-34(N) and mtm-1(C). Data are presented as mean ± SD. n, number of animals scored. p values were deduced from independent Student _t_-test.
Figure 9. Diagrams depicting the molecular mechanisms that regulate the dynamic presentation of PtdIns(3)P on phagosomes during the degradation of apoptotic cells.
(A) Schematic diagram summarizing the oscillation pattern of PtdIns(3)P on phagosomal surfaces in wild-type and different mutant backgrounds. Data represent average values obtained from time-lapse recording of multiple C1, C2, and C3 phagosomes. The light and dark green colors reflect weak and strong PtdIns(3)P signals, respectively. Arrowheads indicate that the end point of the second PtdIns(3)P wave varies, depending on the duration of the phagosome. “0 min” represents the time point when engulfment is just complete. (B) A diagram indicating the functional periods of PIKI-1, VPS-34, and MTM-1 in establishing the biphasic oscillation pattern of PtdIns(3)P on phagosomes, deduced from the PtdIns(3)P localization pattern summarized in (A) and the phagosomal enrichment periods of PIKI-1 and MTM-1. During the gap period, although MTM-1::GFP was not detected on phagosomes, MTM-1 might still display residual activity on phagosomal membranes. The production and elimination of PtdIns(3)P are both essential for phagosome maturation. The rapid production of phagosomal PtdIns(3)P initiates phagosome maturation via recruiting a number of direct or indirect PtdIns(3)P effectors (represented by oval shapes). The subsequent elimination of PtdIns(3)P might enable phagosomes to release the initial set of PtdIns(3)P-effectors and acquire a new set of effectors that function at a later stage of phagosome maturation. (C) Diagram illustrating the PtdIns(3)P-mediated pathway for the degradation of apoptotic cells in C. elegans. The phagocytic receptor CED-1 and its adaptor CED-6 recruit the large GTPase DYN-1 to phagosomal surfaces, which in turn promotes the recruitment of PIKI-1 and VPS-34, resulting in the robust production of PtdIns(3)P on nascent phagosomes. RAB-5 is also proposed to facilitate the association of VPS-34 to phagosomes. MTM-1, which is localized on nascent phagosomes, promotes the rapid turnover of PtdIns(3)P. The phagosomal PtdIns(3)P is required for recruiting multiple phagosome maturation factors, including SNX-1, SNX-6, and LST-4/SNX-9, the direct PtdIns(3)P effectors, and small RAB GTPases, which act together to promote phagosome maturation and the degradation of apoptotic cells. LST-4/SNX-9 also acts to stabilize the association of DYN-1 to phagosomes (dashed line). The question mark indicates that the mechanisms utilized by PtdIns(3)P to recruit RAB GTPases are not clear.
Comment in
- Rise and fall, and rise again: phagosome maturation is controlled by two kinases and one phosphatase.
Robinson R. Robinson R. PLoS Biol. 2012 Jan;10(1):e1001246. doi: 10.1371/journal.pbio.1001246. Epub 2012 Jan 17. PLoS Biol. 2012. PMID: 22272188 Free PMC article. No abstract available.
Similar articles
- PtdIns(4,5)P₂ and PtdIns3P coordinate to regulate phagosomal sealing for apoptotic cell clearance.
Cheng S, Wang K, Zou W, Miao R, Huang Y, Wang H, Wang X. Cheng S, et al. J Cell Biol. 2015 Aug 3;210(3):485-502. doi: 10.1083/jcb.201501038. J Cell Biol. 2015. PMID: 26240185 Free PMC article. - Three sorting nexins drive the degradation of apoptotic cells in response to PtdIns(3)P signaling.
Lu N, Shen Q, Mahoney TR, Liu X, Zhou Z. Lu N, et al. Mol Biol Cell. 2011 Feb 1;22(3):354-74. doi: 10.1091/mbc.E10-09-0756. Mol Biol Cell. 2011. PMID: 21148288 Free PMC article. - Autophagy genes coordinate with the class II PI/PtdIns 3-kinase PIKI-1 to regulate apoptotic cell clearance in C. elegans.
Cheng S, Wu Y, Lu Q, Yan J, Zhang H, Wang X. Cheng S, et al. Autophagy. 2013 Dec;9(12):2022-32. doi: 10.4161/auto.26323. Epub 2013 Oct 21. Autophagy. 2013. PMID: 24165672 - Phagosome maturation during the removal of apoptotic cells: receptors lead the way.
Zhou Z, Yu X. Zhou Z, et al. Trends Cell Biol. 2008 Oct;18(10):474-85. doi: 10.1016/j.tcb.2008.08.002. Epub 2008 Sep 4. Trends Cell Biol. 2008. PMID: 18774293 Free PMC article. Review. - Phosphatidylinositol Kinases and Phosphatases in Entamoeba histolytica.
Nakada-Tsukui K, Watanabe N, Maehama T, Nozaki T. Nakada-Tsukui K, et al. Front Cell Infect Microbiol. 2019 Jun 6;9:150. doi: 10.3389/fcimb.2019.00150. eCollection 2019. Front Cell Infect Microbiol. 2019. PMID: 31245297 Free PMC article. Review.
Cited by
- PI3K in cancer: divergent roles of isoforms, modes of activation and therapeutic targeting.
Thorpe LM, Yuzugullu H, Zhao JJ. Thorpe LM, et al. Nat Rev Cancer. 2015 Jan;15(1):7-24. doi: 10.1038/nrc3860. Nat Rev Cancer. 2015. PMID: 25533673 Free PMC article. Review. - LC3-associated phagocytosis promotes glial degradation of axon debris after injury in Drosophila models.
Szabó Á, Vincze V, Chhatre AS, Jipa A, Bognár S, Varga KE, Banik P, Harmatos-Ürmösi A, Neukomm LJ, Juhász G. Szabó Á, et al. Nat Commun. 2023 May 29;14(1):3077. doi: 10.1038/s41467-023-38755-4. Nat Commun. 2023. PMID: 37248218 Free PMC article. - Programmed cell death and clearance of cell corpses in Caenorhabditis elegans.
Wang X, Yang C. Wang X, et al. Cell Mol Life Sci. 2016 Jun;73(11-12):2221-36. doi: 10.1007/s00018-016-2196-z. Epub 2016 Apr 5. Cell Mol Life Sci. 2016. PMID: 27048817 Free PMC article. Review. - Class II phosphatidylinositol 3-kinase isoforms in vesicular trafficking.
Yoshioka K. Yoshioka K. Biochem Soc Trans. 2021 Apr 30;49(2):893-901. doi: 10.1042/BST20200835. Biochem Soc Trans. 2021. PMID: 33666217 Free PMC article. Review. - The small GTPase RAB-35 facilitates the initiation of phagosome maturation and acts as a robustness factor for apoptotic cell clearance.
Haley R, Zhou Z. Haley R, et al. Small GTPases. 2021 May;12(3):188-201. doi: 10.1080/21541248.2019.1680066. Epub 2019 Oct 24. Small GTPases. 2021. PMID: 31607221 Free PMC article.
References
- Falasca M, Maffucci T. Rethinking phosphatidylinositol 3-monophosphate. Biochim Biophys Acta. 2009;1793:1795–1803. - PubMed
- Backer J. M. The regulation and function of Class III PI3Ks: novel roles for Vps34. Biochem J. 2008;410:1–17. - PubMed
- Di Paolo G, De Camilli P. Phosphoinositides in cell regulation and membrane dynamics. Nature. 2006;443:651–657. - PubMed
Publication types
MeSH terms
Substances
Grants and funding
- GM067848/GM/NIGMS NIH HHS/United States
- T32 NS043124/NS/NINDS NIH HHS/United States
- T32-NS043124/NS/NINDS NIH HHS/United States
- R01 GM067848/GM/NIGMS NIH HHS/United States
- K12-GM084897-03/GM/NIGMS NIH HHS/United States
- K12 GM084897/GM/NIGMS NIH HHS/United States
LinkOut - more resources
Full Text Sources
Molecular Biology Databases
Research Materials
Miscellaneous
