Rantes/Ccl5 influences hematopoietic stem cell subtypes and causes myeloid skewing - PubMed (original) (raw)
Rantes/Ccl5 influences hematopoietic stem cell subtypes and causes myeloid skewing
Aysegul V Ergen et al. Blood. 2012.
Abstract
HSCs undergo dramatic changes with aging. An increase in absolute numbers of HSCs along with a functional deficit in reconstitution potential and a shift toward production of myeloid cells are the hallmarks of murine hematopoietic aging. Here, we show that high levels of the inflammatory cytokine Rantes are found in the aging stem cell milieu. Forced overproduction of Rantes by retroviral expression in BM progenitors resulted in a deficit of T-cell output, and brief ex vivo exposure of HSCs to Rantes resulted in a decrease in T-cell progeny concomitant with an increase in myeloid progenitors. In contrast, Rantes knockout (KO) animals exhibit a decrease in myeloid-biased HSCs and myeloid progenitors and an increase in T cells and lymphoid-biased HSCs. KO HSCs retained their HSC subtype distribution and they produced more lymphoid-biased HSCs in transplantations. Rantes deficiency also resulted in a decreased mammalian target of rapamycin (mTOR) activity in KLS cells. In a heterochronic transplantation setting, we further show that aged HSCs placed in a young environment generate less myeloid cells. These data establish a critical role for environmental factors in the establishment of the aged-associated myeloid skewing phenotype, which may contribute to age-associated immune deficiency.
Figures
Figure 1
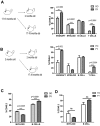
Young environment does not support myeloid development. (A) Graphical representation of old into young (O→Y) vs old into old (O→O) transplantation. WBM cells (2-2.5 × 10⁶) from 17- to 18-month-old CD45.2 mice were transplanted into either 2-month-old (defined as O→Y) or 17- to 18-month-old (defined as O→O) CD45.1 mice. Lineage distribution of donor-derived cells of O→O vs O→Y transplants at 16 weeks (n = 10 O→Y, n = 8 O→O). (B) Graphical representation of young into young (Y→Y) vs young into old (Y→O) transplantation. WBM cells (2-2.5 × 10⁶) from 2-month-old CD45.2 mice were transplanted into either 2-month-old (defined as Y→Y) or 17- to 18-month-old (defined as Y→O) CD45.1 mice. Lineage distribution of donor-derived cells of Y→O vs Y→Y at 16 weeks (n = 4 Y→Y, n = 7 Y→O). (C) Graph represents lineage distribution of donor-derived cells of O→O vs O→Y transplants at 16 weeks excluding T cells (n = 10 O→Y, n = 8 O→O). (D) Graph represents lineage distribution of donor-derived cells of Y→O vs Y→Y transplants at 16 weeks excluding T cells (n = 4 Y→Y, n = 7 Y→O). Error bars represent SEM. Representative of 2 experiments.
Figure 2
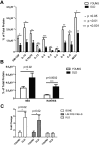
Cytometric bead array on aged and young BM and real-time PCR analysis for Rantes expression in old and young BM populations. Cytokine levels in the BM were detected with a mouse cytokine bead array and FacsArray plate reader (both from BD Biosciences). We purchased each cytokine's cytometric bead array kit from BD Biosciences which can detect picogram levels of protein in serum or cell-culture supernatant (Flex set; BD Biosciences) and used in a multiplex manner. (A) Graph represents protein levels of cytokines either in the old or young BM supernatant normalized to total protein levels. (B) Graph represents Mig and Rantes protein levels either in the old or young BM supernatant (n = 10 young, n = 6 old). (C) Quantitave real-time PCR analysis of Rantes on mRNA purified from old or young bone cells, lineage-positive and hematopoietic stem-progenitor (KLS) cells (n = 3 young, n = 3 old). Error bars represent SEM.
Figure 3
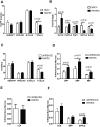
Exposure to Rantes causes myeloid skewing. (A) The graph shows the proportions of lineages (Myeloid, B cells, and T cells) of the GFP+ donor-derived WBCs transduced with MSCV-GFP or MSCV-Rantes-IRES-GFP analyzed 12 weeks after transplantation (n = 10 MSCV, n = 10 Rantes). Overall engraftment of transduced cells is also indicated (“Engraft”). (B) Quantitative real-time PCR analysis of the indicated genes in progenitors (LSGFP+ cells) from MSCV-GFP or Rantes-GFP transduced progenitors after 48 hours in vitro (n = 3 MSCV, n = 3 Rantes). (C) PB analyses of mice transplanted with HSCs that are treated or untreated with Rantes ex vivo before competitive transplantation. Donor contribution to myeloid and lymphoid lineages is presented as the percentage of donor-derived myeloid, B, and T cells 16 weeks posttransplantation. (D) BM frequencies of donor-derived myeloid progenitors in BM from mice transplanted with Rantes- or untreated HSCs (SPKLS) in a competitive transplantation: CMPs, GMPs, MEPs. Analysis of HSC-derived progeny in recipients 5 months posttransplantation (n = 7 Untreated, n = 7 Rantes). (E) BM frequencies of donor-derived CLPs from Rantes- or untreated HSC as in panel D. (F) BM frequencies of donor-derived stem and progenitor populations: KLS, MPP (KLS Flk2+), SPKLS, SPKLS-CD150+ after transplantation of Rantes- or untreated HSC as in panel D. CMP: Lin−, IL7rα−, Sca-1−, c-Kit+, FcγRloCD34+; GMP: Lin−, IL7rα−, Sca-1−, c-Kit+, FcγR+CD34+; MEP: Lin−, IL7rα−, Sca-1−, c-Kit+, FcγR−CD34−; and CLP: Lin−, IL7rα+, Sca-1lo, c-Kitlo, Flt3+ (n = 7 Untreated, n = 7 Rantes). Error bars represent SEM. Representative of 2 experiments
Figure 4
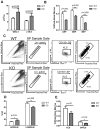
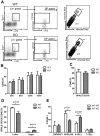
Rantes KO mice have less myeloid progenitors and less myeloid-biased stem cells. (A) CBC analyses of 5- to 6-month-old WT and Rantes KO mice. Graphical representation of CBC analysis of WT or KO mice. (B) BM frequencies of myeloid progenitors (CMP, GMP, MEP) from 5- to 6-month-old WT and KO mice. (C) BM derived from WT or Rantes KO mice was isolated and analyzed for Ly- and My-bi HSCs as follows: KLS cells were identified, followed by the CD150+ fraction, followed by analysis of lower and upper SP phenotypes. Representative FACS profiles of lower and upper SPKLS-CD150+ HSCs from WT and Rantes KO mice. (D) Frequencies of lower and upper SPKLS-CD150+ cells from WT and KO mice. (E) BM frequencies of stem and progenitor populations: KSL, SPKLS from 5- to 6-month-old WT and KO mice. n = 5 WT, n = 5 KO in (A-D). Error bars represent SEM. Representative of 2 experiments
Figure 5
Rantes KO HSCs exhibit similar engraftment potential. (A) BM derived from 9-month-old WT or Rantes KO mice was isolated and analyzed for Ly- and My-bi HSCs as follows: KLS cells were identified, followed by the CD150+ fraction, followed by analysis of lower and upper SP phenotypes. Representative FACS profiles of lower and upper SPKLS-CD150+ HSCs from WT and Rantes KO mice. (B) Overall engraftment of 9-month-old WT or KO HSCs (SPKLS-CD150+) in the PB of recipient mice at 4th, 8th, 12th, and 16th week after transplantation (n = 5 WT, n = 6 KO). (C) Analysis of the BM of recipient mice to determine donor cell contribution to the total stem cell compartment (SPKLS-CD150+) 20 weeks posttransplantation of WT or KO HSCs. (D) Analysis of the BM of recipient mice for the frequencies of donor-derived lower and upper SPKLS-CD150+ cells. (E) Transplantation of WT HSCs from 18-month-old mice into WT or Rantes KO mice. The graph shows the lineage distribution of donor-derived cells in the WT or KO mice at 12 weeks posttranplantation. Overall engraftment of donor cells is also indicated as (“Engraft”). Error bars represent SEM. Representative of 2 experiments (n = 6 WT, n = 7 KO).
Figure 6
mTOR activity in WT and KO progenitors. BM cells were isolated from 2-month-old WT or KO mice and stained with Abs specific to cell-surface markers to identify c-Kit+lin−Sca-1+ (KLS) progenitors, followed by intracellular staining with Abs against (A) p-mTOR and (B) p-S6. (Left side) Histograms of progenitors (KLS) that are representative of 3 independent experiments each involving 3 to 5 mice in each group. Gray and black lines are negative controls (secondary Ab only for panels A and B), black line for cells from WT mice and gray line for cells from KO mice. Blue line represents profile of stained BM cells from WT mice and red line represents profile of stained BM cells from KO mice. The median fluorescence intensity (MFI) ± SD of representative of one experiment is shown at the right side. **P < .01; *P < .05 (n = 4 WT and n = 4 KO).
Similar articles
- A new mechanism for the aging of hematopoietic stem cells: aging changes the clonal composition of the stem cell compartment but not individual stem cells.
Cho RH, Sieburg HB, Muller-Sieburg CE. Cho RH, et al. Blood. 2008 Jun 15;111(12):5553-61. doi: 10.1182/blood-2007-11-123547. Epub 2008 Apr 15. Blood. 2008. PMID: 18413859 Free PMC article. - CD41 expression marks myeloid-biased adult hematopoietic stem cells and increases with age.
Gekas C, Graf T. Gekas C, et al. Blood. 2013 May 30;121(22):4463-72. doi: 10.1182/blood-2012-09-457929. Epub 2013 Apr 5. Blood. 2013. PMID: 23564910 - Rapamycin enhances long-term hematopoietic reconstitution of ex vivo expanded mouse hematopoietic stem cells by inhibiting senescence.
Luo Y, Li L, Zou P, Wang J, Shao L, Zhou D, Liu L. Luo Y, et al. Transplantation. 2014 Jan 15;97(1):20-9. doi: 10.1097/TP.0b013e3182a7fcf8. Transplantation. 2014. PMID: 24092377 Free PMC article. - In vivo clonal analysis of aging hematopoietic stem cells.
Yamamoto R, Nakauchi H. Yamamoto R, et al. Mech Ageing Dev. 2020 Dec;192:111378. doi: 10.1016/j.mad.2020.111378. Epub 2020 Oct 3. Mech Ageing Dev. 2020. PMID: 33022333 Free PMC article. Review. - Aging of the hematopoietic system.
Snoeck HW. Snoeck HW. Curr Opin Hematol. 2013 Jul;20(4):355-61. doi: 10.1097/MOH.0b013e3283623c77. Curr Opin Hematol. 2013. PMID: 23739721 Review.
Cited by
- B cells in the aging immune system: time to consider B-1 cells.
Holodick NE, Rothstein TL. Holodick NE, et al. Ann N Y Acad Sci. 2015 Dec;1362(1):176-87. doi: 10.1111/nyas.12825. Epub 2015 Jul 20. Ann N Y Acad Sci. 2015. PMID: 26194480 Free PMC article. Review. - Aging of the microenvironment influences clonality in hematopoiesis.
Vas V, Senger K, Dörr K, Niebel A, Geiger H. Vas V, et al. PLoS One. 2012;7(8):e42080. doi: 10.1371/journal.pone.0042080. Epub 2012 Aug 6. PLoS One. 2012. PMID: 22879906 Free PMC article. - Hematopoietic Stem Cells and Their Bone Marrow Niches.
Pinho S, Zhao M. Pinho S, et al. Adv Exp Med Biol. 2023;1442:17-28. doi: 10.1007/978-981-99-7471-9_2. Adv Exp Med Biol. 2023. PMID: 38228956 Free PMC article. - Pulmonary cytokine composition differs in the setting of alcohol use disorders and cigarette smoking.
Burnham EL, Kovacs EJ, Davis CS. Burnham EL, et al. Am J Physiol Lung Cell Mol Physiol. 2013 Jun 15;304(12):L873-82. doi: 10.1152/ajplung.00385.2012. Epub 2013 Apr 19. Am J Physiol Lung Cell Mol Physiol. 2013. PMID: 23605000 Free PMC article. - Titanium implants and silent inflammation in jawbone-a critical interplay of dissolved titanium particles and cytokines TNF-α and RANTES/CCL5 on overall health?
Lechner J, Noumbissi S, von Baehr V. Lechner J, et al. EPMA J. 2018 Jun 8;9(3):331-343. doi: 10.1007/s13167-018-0138-6. eCollection 2018 Sep. EPMA J. 2018. PMID: 30174768 Free PMC article.
References
- Dorshkind K, Montecino-Rodriguez E, Signer RA. The ageing immune system: is it ever too old to become young again? Nat Rev Immunol. 2009;9(1):57–62. - PubMed
- Rossi DJ, Jamieson CH, Weissman IL. Stems cells and the pathways to aging and cancer. Cell. 2008;132(4):681–696. - PubMed
- Morrison SJ, Wandycz AM, Akashi K, Globerson A, Weissman IL. The aging of hematopoietic stem cells. Nat Med. 1996;2(9):1011–1016. - PubMed
- Kim M, Moon HB, Spangrude GJ. Major age-related changes of mouse hematopoietic stem/progenitor cells. Ann N Y Acad Sci. 2003;996:195–208. - PubMed
Publication types
MeSH terms
Substances
Grants and funding
- R56 DK092883/DK/NIDDK NIH HHS/United States
- T32 HL092332/HL/NHLBI NIH HHS/United States
- P30 CA125123/CA/NCI NIH HHS/United States
- R01 DK058192/DK/NIDDK NIH HHS/United States
- RC2 AG036562/AG/NIA NIH HHS/United States
- R01 DK092883/DK/NIDDK NIH HHS/United States
- AG034451/AG/NIA NIH HHS/United States
- DK092883/DK/NIDDK NIH HHS/United States
- R21 AG034451/AG/NIA NIH HHS/United States
- 1RC2AG036562/AG/NIA NIH HHS/United States
LinkOut - more resources
Full Text Sources
Other Literature Sources
Medical
Molecular Biology Databases
Research Materials
Miscellaneous
