Structure-function mapping of a heptameric module in the nuclear pore complex - PubMed (original) (raw)
Structure-function mapping of a heptameric module in the nuclear pore complex
Javier Fernandez-Martinez et al. J Cell Biol. 2012.
Abstract
The nuclear pore complex (NPC) is a multiprotein assembly that serves as the sole mediator of nucleocytoplasmic exchange in eukaryotic cells. In this paper, we use an integrative approach to determine the structure of an essential component of the yeast NPC, the ~600-kD heptameric Nup84 complex, to a precision of ~1.5 nm. The configuration of the subunit structures was determined by satisfaction of spatial restraints derived from a diverse set of negative-stain electron microscopy and protein domain-mapping data. Phenotypic data were mapped onto the complex, allowing us to identify regions that stabilize the NPC's interaction with the nuclear envelope membrane and connect the complex to the rest of the NPC. Our data allow us to suggest how the Nup84 complex is assembled into the NPC and propose a scenario for the evolution of the Nup84 complex through a series of gene duplication and loss events. This work demonstrates that integrative approaches based on low-resolution data of sufficient quality can generate functionally informative structures at intermediate resolution.
Figures
Figure 1.
Domain mapping of the Nup84 complex. (top) Predicted secondary structure of truncated nup constructs. Vertical lines represent the sequence of each nup to scale, and secondary structure predictions are shown as horizontal bars of length proportional to the confidence of the prediction (α helices are shown in magenta and β-strands in cyan). PAL sites (Dokudovskaya et al., 2006) defining the limits of the truncations are indicated with arrowed black letters; truncation points selected by sequence alignment are indicated with arrowed green letters. (bottom) Coomassie-stained SDS-PAGE of affinity-purified PrA-tagged truncated Nup84 complex nups. Protein bands marked by filled circles at the left side of the gel lanes were identified by MS. The identity of the copurifying proteins is indicated in order below each lane (PrA-tagged nups are shown in blue, copurifying nups in black [N = Nup, S1 = Seh1, and S13 = Sec13], and contaminants in orange). WT, wild type.
Figure 2.
Identification of interacting regions within the Nup84 complex. (A) Copurification profile of the different truncations analyzed. Horizontal gray lines represent the amino acid residue length of each protein and truncated version; amino acid residue positions are shown on top of the lines. On the right, MS-detected copurifying Nup84 complex nups are indicated (+), and undetected proteins are also indicated (−; see
Table S3
for details). (B) Domain mapping. Truncations showing both nuclear rim localization by immunofluorescence and PAL profile consistent with proper folding were used to interpret a lost interaction as caused by the loss of at least one interaction point present in the deleted nup region (represented by red lines on the wild-type line). Each region is identified by red roman numbers. The identified interactions are as follows: Nup133 Region I interacts with Nup120, Nup145c, Nup85, Nup84, Seh1, and Sec13; Nup120 Region II interacts with Nup133, Nup145c, Nup85, Nup84, Seh1, and Sec13; Nup85 Region III interacts with Seh1; Nup85 Region IV interacts with Nup133, Nup120, Nup145c, Nup84, and Sec13; Nup84 Region V interacts with Nup133, Nup120, Nup145c, Nup85, Seh1, and Sec13; Nup145c Region VI interacts with Nup120, Nup85, and Seh1; Nup145c Region VII interacts with Sec13; Nup145c Region VIII interacts with Nup120, Nup85, and Seh1; Nup145c Region IX interacts with Nup133 and Nup84; Nup145c Region X interacts with Sec13; and Nup145c Region XI interacts with Nup120, Nup85, and Seh1.
Figure 3.
EM analysis of the Nup84 complex. (A–C) Affinity-purified Nup84 complexes corresponding to the full-length complex (A), Nup85(233–744) truncation (B), and the Nup84 complex lacking Nup133 (C) were purified by either sucrose gradient (A and B) or size-exclusion chromatography (C). Coomassie-stained SDS-PAGE of the precipitated input (In) and collected fractions are shown. Fractions indicated with arrows were analyzed by negative-stain EM. Class averages for each complex are shown in the bottom part of each panel. The missing mass observed in Nup85(233–744) truncation (B) and the six-member complex (C) are indicated with arrowheads. WT, wild type. Bars, 10 nm.
Figure 4.
Integrative structure determination of the Nup84 complex. First, structural data are generated by experiments and computational methods. Second, the system is represented by mostly atomic structures of the subunits, and the data are translated into spatial restraints. Third, an ensemble of structures that satisfies the data is obtained by minimizing violations of the spatial restraints, starting from many different random configurations. Fourth, the ensemble is clustered into distinct sets of structures on the basis of similarities and analyzed in terms of geometry and accuracy.
Figure 5.
Density map for the Nup84 complex ensemble. (A) Two views of the localization density map are shown for the ensemble. The gray outer envelope represents the density within which 90% of all Nup84 complex structures in the final ensemble were localized, and the colored inner envelope was thresholded by visual inspection (to a volume containing 37% of ensemble density) to match the volume of an individual structure (also see
Video 1
). A few example structures that best fit the inner envelope according to 3D cross-correlation score and have among the lowest C-α RMSDs from the average structure comprised of the 9,479 final good-scoring solutions are shown. (B) Two views of the density map, containing two fitted ribbon structures from the ensemble.
Figure 6.
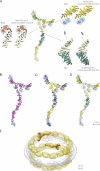
Structural features of the Nup84 complex. (A) Comparison of protein–protein interfaces in our ensemble with crystallographically determined interfaces. Atomic structures for the Nup85-Seh1 (NCBI Protein Data Bank accession no. 3ewe; Brohawn et al., 2008), Nup145c-Sec13 (PDB accession no. 3bg0; Hsia et al., 2007), and Nup84-Nup145c (PDB accession no. 3iko; Nagy et al., 2009) interfaces are shown alongside the best recapitulation of each interface found among the 9,479 ensemble structures, in which the best interface has the lowest RMSD between the dimer in the model and a crystal structure of the same dimer. A single full Nup84 complex structure is provided for reference. (B) Secondary structure elements. Helical regions (α-solenoids) are shown in pink. Sheet regions (β-propellers) are shown in cyan. (C) Indication of the N and C termini positions. Each of the Nup84 complex proteins is graded from its N terminus (blue) to the C terminus (yellow). (D) Crystal structure coverage. Where crystal structures were used to represent components of the Nup84 complex structure, the complex is colored; where atomic comparative models were used, fragments are shown in gray. (E) The density of a representative Nup84 complex structure was fitted into our previously published NPC map (Alber et al., 2007b) based on the relative positions of each component within the map. One of eight instances of the structure in each of the two outer rings of the complex is shown.
Figure 7.
Mapping the Nup84 complex connectivity to the NPC core. (A) Predicted secondary structure of truncated nup constructs, as described in the Fig. 1 legend, are shown on the top. Coomassie-stained SDS-PAGE of affinity-purified PrA-tagged truncated Nup84 complex nups and copurifying NPC core nups are shown in the middle. Protein bands marked by filled circles at the left side of each gel lane were identified by MS. The identity of the copurifying proteins is indicated in order below each lane (PrA-tagged nups are shown in blue, Nup84 complex copurifying nups in black, NPC core copurifying nups in red, and contaminates in orange; N = Nup, S1 = Seh1, and S13 = Sec13). Lanes corresponding to truncations that show no connection to other Nup84 complex components are shown on the right and were not used for the analysis. WT, wild type. (B) Quantification of the relative connectivity to the NPC core of the Nup84 complex truncation mutants. A bar graph showing the average relative molar ratio of the copurified NPC core nups is shown (see Materials and methods for details). Bars show the average value for each mutant, and the error bars define the upper and lower values obtained. Each bar is aligned with its corresponding gel lane in A. Proportional divisions (dashed gray lanes) were made, and a color code was assigned to each division (right) from dark blue to white (colored squares) to match the increasing degree of connectivity. n = 2. AU, arbitrary unit. (C) A heat map reflecting the key regions for the connectivity of the Nup84 complex to the NPC core. The color code defined in B was used to generate a heat map using a single Nup84 complex structure from the ensemble.
Figure 8.
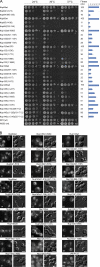
Fitness and NPC clustering analysis of the Nup84 complex truncations. (A) Growth tests at different temperatures (24, 30, and 37°C) for the full-length (wild type [wt]) and truncated versions of the Nup84 complex nups. Serial 10-fold dilutions of cells were spotted on YEPD plates and grown at the indicated temperatures for 1–3 d. Parental strains DF5 and w303 as well as the full-length genomically tagged Nup84 complex nups (Nup84, Nup85, Nup133, Nup120, and Nup145c) were included as controls. Each growing phenotype was quantified by semiquantitative methods (see Materials and methods), and the obtained value (in arbitrary units [AU]) is shown on the right of each column. Plotted fitness value (mean ± SEM) for each measurement is shown on the right. (B) The left image of each column shows the localization of a Nup49p-CFP reporter in wild-type and truncation mutants as determined by fluorescence microscopy. A NUP133 gene deletion is also shown as a reference for NPC clustering (Belgareh and Doye, 1997). The right image of each column shows the differential interference contrast image of the same cells. The number shown on the bottom left corner of the fluorescence picture represents the measured degree of clustering for each strain (represented by their normalized CV, multiplied by 100 for representation purposes) in arbitrary units for n = 30 cells (see Materials and methods). Bars, 5 µm.
Figure 9.
Phenotypic heat maps of the Nup84 complex: Fitness relates with loss of interactions between the Nup84 complex and other core NPC nups, whereas NPC clustering is related to NE membrane stability. (A and B) Effect of truncated regions of the Nup84 complex on organism fitness and NPC clustering. The severity of fitness phenotypes (A) and NPC clustering (B) for specific truncations of the Nup84 complex are shown mapped into a single Nup84 complex structure. The color code is shown in between the maps and in
Fig. S3
. (C) Membrane-destabilizing assay. 0.4% BA was added to wild-type (wt) or truncated mutant Nup133(1–898) (similar behavior was observed for other mutant strains; not depicted). The time course localization of fluorescent reporter Nup49-CFP after treatment and for nontreated controls is shown on the top. Quantification of the level of NPC clustering (see Materials and methods) for each time point is shown on the bottom (mean ± SD; n = 30). Bar, 5 µm.
Figure 10.
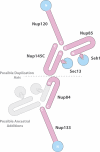
Potential origin of the Nup84 complex through ancient gene duplications and losses. A diagram of the Nup84 complex nup arrangement is shown. β-propeller domains are colored in cyan, α-solenoid domains are colored in magenta, and invasion domains (Hsia et al., 2007; Brohawn et al., 2008) are indicated with magenta arrows. The N- and C-terminal ends of each protein are highlighted. The hypothetical duplication axis is shown as a dashed gray line dividing the complex between the Nup145c and Nup84 interaction surfaces. Possible ancestral nups lost after the duplication are shown as faded gray domains.
Similar articles
- Integrative structure-function mapping of the nucleoporin Nup133 suggests a conserved mechanism for membrane anchoring of the nuclear pore complex.
Kim SJ, Fernandez-Martinez J, Sampathkumar P, Martel A, Matsui T, Tsuruta H, Weiss TM, Shi Y, Markina-Inarrairaegui A, Bonanno JB, Sauder JM, Burley SK, Chait BT, Almo SC, Rout MP, Sali A. Kim SJ, et al. Mol Cell Proteomics. 2014 Nov;13(11):2911-26. doi: 10.1074/mcp.M114.040915. Epub 2014 Aug 19. Mol Cell Proteomics. 2014. PMID: 25139911 Free PMC article. - Architecture of the linker-scaffold in the nuclear pore.
Petrovic S, Samanta D, Perriches T, Bley CJ, Thierbach K, Brown B, Nie S, Mobbs GW, Stevens TA, Liu X, Tomaleri GP, Schaus L, Hoelz A. Petrovic S, et al. Science. 2022 Jun 10;376(6598):eabm9798. doi: 10.1126/science.abm9798. Epub 2022 Jun 10. Science. 2022. PMID: 35679425 Free PMC article. - Structural and functional analysis of Nup120 suggests ring formation of the Nup84 complex.
Seo HS, Ma Y, Debler EW, Wacker D, Kutik S, Blobel G, Hoelz A. Seo HS, et al. Proc Natl Acad Sci U S A. 2009 Aug 25;106(34):14281-6. doi: 10.1073/pnas.0907453106. Epub 2009 Aug 11. Proc Natl Acad Sci U S A. 2009. PMID: 19706512 Free PMC article. - Toward the atomic structure of the nuclear pore complex: when top down meets bottom up.
Hoelz A, Glavy JS, Beck M. Hoelz A, et al. Nat Struct Mol Biol. 2016 Jul;23(7):624-30. doi: 10.1038/nsmb.3244. Epub 2016 Jun 6. Nat Struct Mol Biol. 2016. PMID: 27273515 Free PMC article. Review. - [Nuclear pores: from yeast to higher eukaryotes].
Doye V. Doye V. J Soc Biol. 2002;196(4):349-54. J Soc Biol. 2002. PMID: 12645306 Review. French.
Cited by
- Molecular basis for Nup37 and ELY5/ELYS recruitment to the nuclear pore complex.
Bilokapic S, Schwartz TU. Bilokapic S, et al. Proc Natl Acad Sci U S A. 2012 Sep 18;109(38):15241-6. doi: 10.1073/pnas.1205151109. Epub 2012 Sep 5. Proc Natl Acad Sci U S A. 2012. PMID: 22955883 Free PMC article. - Toward understanding the structure of the vertebrate nuclear pore complex.
Beck M, Glavy JS. Beck M, et al. Nucleus. 2014 Mar-Apr;5(2):119-23. doi: 10.4161/nucl.28739. Epub 2014 Apr 3. Nucleus. 2014. PMID: 24699243 Free PMC article. Review. - Assembly and Molecular Architecture of the Phosphoinositide 3-Kinase p85α Homodimer.
LoPiccolo J, Kim SJ, Shi Y, Wu B, Wu H, Chait BT, Singer RH, Sali A, Brenowitz M, Bresnick AR, Backer JM. LoPiccolo J, et al. J Biol Chem. 2015 Dec 18;290(51):30390-405. doi: 10.1074/jbc.M115.689604. Epub 2015 Oct 16. J Biol Chem. 2015. PMID: 26475863 Free PMC article. - Cell type-specific nuclear pores: a case in point for context-dependent stoichiometry of molecular machines.
Ori A, Banterle N, Iskar M, Andrés-Pons A, Escher C, Khanh Bui H, Sparks L, Solis-Mezarino V, Rinner O, Bork P, Lemke EA, Beck M. Ori A, et al. Mol Syst Biol. 2013;9:648. doi: 10.1038/msb.2013.4. Mol Syst Biol. 2013. PMID: 23511206 Free PMC article. - Engineered high-affinity nanobodies recognizing staphylococcal Protein A and suitable for native isolation of protein complexes.
Fridy PC, Thompson MK, Ketaren NE, Rout MP. Fridy PC, et al. Anal Biochem. 2015 May 15;477:92-4. doi: 10.1016/j.ab.2015.02.013. Epub 2015 Feb 21. Anal Biochem. 2015. PMID: 25707320 Free PMC article.
References
Publication types
MeSH terms
Substances
Grants and funding
- R01 GM54762/GM/NIGMS NIH HHS/United States
- R01 GM083960/GM/NIGMS NIH HHS/United States
- P41 RR000862/RR/NCRR NIH HHS/United States
- U54 RR022220/RR/NCRR NIH HHS/United States
- U54 GM103511/GM/NIGMS NIH HHS/United States
- R01 GM054762/GM/NIGMS NIH HHS/United States
- RR00862/RR/NCRR NIH HHS/United States
- R01 GM62427/GM/NIGMS NIH HHS/United States
- U01 GM098256/GM/NIGMS NIH HHS/United States
- R01 GM071329/GM/NIGMS NIH HHS/United States
- R01 GM062427/GM/NIGMS NIH HHS/United States
LinkOut - more resources
Full Text Sources
Other Literature Sources
Molecular Biology Databases


