Expression of the zinc finger transcription factor zDC (Zbtb46, Btbd4) defines the classical dendritic cell lineage - PubMed (original) (raw)
Expression of the zinc finger transcription factor zDC (Zbtb46, Btbd4) defines the classical dendritic cell lineage
Matthew M Meredith et al. J Exp Med. 2012.
Abstract
Classical dendritic cells (cDCs), monocytes, and plasmacytoid DCs (pDCs) arise from a common bone marrow precursor (macrophage and DC progenitors [MDPs]) and express many of the same surface markers, including CD11c. We describe a previously uncharacterized zinc finger transcription factor, zDC (Zbtb46, Btbd4), which is specifically expressed by cDCs and committed cDC precursors but not by monocytes, pDCs, or other immune cell populations. We inserted diphtheria toxin (DT) receptor (DTR) cDNA into the 3' UTR of the zDC locus to serve as an indicator of zDC expression and as a means to specifically deplete cDCs. Mice bearing this knockin express DTR in cDCs but not other immune cell populations, and DT injection into zDC-DTR bone marrow chimeras results in cDC depletion. In contrast to previously characterized CD11c-DTR mice, non-cDCs, including pDCs, monocytes, macrophages, and NK cells, were spared after DT injection in zDC-DTR mice. We compared immune responses to Toxoplasma gondii and MO4 melanoma in DT-treated zDC- and CD11c-DTR mice and found that immunity was only partially impaired in zDC-DTR mice. Our results indicate that CD11c-expressing non-cDCs make significant contributions to initiating immunity to parasites and tumors.
Figures
Figure 1.
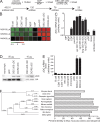
zDC expression is specific to cDCs. (A) Analysis of gene array data of mouse DEC-205+ (CD8+) cDCs, DCIR2+ (CD4+) cDCs, pre-DCs, CDPs, MDPs, and monocytes. (B) Heat maps showing normalized zDC expression depicted on log2 scale from three zDC probes on Affymetrix 430 2.0 chips. All populations were prepared in triplicate. (C) zDC transcript levels in mouse MPs, MDPs, CDPs, pre-DCs, splenic and lung cDC subsets, pDCs, and steady-state and activated monocytes determined by Q-PCR and normalized to GAPDH. All populations were prepared in triplicate and error bars indicate SEM. (D) zDC Western blot of mouse CD11b-enriched monocytes/macrophages, PDCA-1–enriched pDCs, and sorted DEC-205+ and DCIR2+ cDCs. Histone H4 blot is shown as a loading control. The blot represents one experiment of three with equivalent results. Diluted cDC lysates (10 µg) are included to show that zDC protein is still detectable even with limited cell lysate input. (E) Gene array expression of human ZDC (probe 227329_at on Affymetrix U133 Plus 2.0) by sorted human blood populations. Error bars indicate SEM. This panel was adapted with permission from Robbins et al. (2008). (F) Dendrogram of vertebrate zDC amino acid sequences (left) and percent identity to mouse (right).
Figure 2.
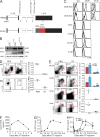
DTR expression regulated by the zDC locus permits DT ablation of cDCs. (A) Schematic diagram of wild-type and DTR knockin zDC loci. 5′ and 3′ UTR are shown in black, coding sequences in white, and the locations of BTB/POZ and zinc finger domains are indicated. IRES (gray) and DTR-mCherry (red) are inserted immediately after the endogenous zDC stop codon in exon 5. (B) Western blots for zDC, hDTR, and Histone H4 (loading control) on CD11c-enriched splenocytes from zDC+/+, zDC+/DTR, and zDCDTR/DTR mice. (C) Flow cytometry histograms of DTR staining by CD8+ and CD4+ cDCs (Lin−Ly6C−CD11chiMHCII+), pDCs (Lin−CD11cintPDCA-1+), monocytes (Lin−CD11b+CD115+), B cells (CD3−NK1.1−CD19+), and T cells (CD3+CD19−NK1.1−) from the spleens (spl), skLN, and mLN of zDC-DTR mice (black line) and wild-type littermates (gray shaded). (D) Flow cytometry plots of splenic cDCs (gated on Lin−) and bone marrow pre-DCs (gated on Lin−CD45R−CD11c+MHCII−) in zDC-DTR bone marrow chimeras injected with PBS or DT. Numbers indicate percentage of organ. Graphs on right represent three to four experiments with each point representing one mouse and horizontal lines representing the means. (E) CD11chiMHCII+ cDC and CD11c+MHCIIhi mDC abundance in skLN, mLN, lung, and liver in PBS- and DT-treated zDC-DTR bone marrow chimeras, gated on Lin− in skLN and mLN, and Lin−CD45+ in liver and lung. (F) Flt3L concentrations in sera of DT-treated zDC-DTR bone marrow chimeras determined by ELISA at multiple time points after DT injection. (G and H) cDC abundance in spleen (G) and skLN (H) at multiple time points after DT injection. Results represent two to three experiments with two to three mice per group per experiment. Error bars indicate SEM. Lin−; CD3−CD19−NK1.1−.
Figure 3.
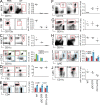
DT ablation in zDC-DTR bone marrow chimeras is specific to cDCs and spares other CD11c-expressing cells. (A–I) Steady-state splenic cDCs (A) and bone marrow pre-DCs (B; as defined in Fig. 2 D), CD45+CD3–B220–CD11chiMHCII+ small intestine (SI) lamina propria DCs (C, top) and DC subsets (C, bottom), CD19+ splenic B cells (D), CD19−NK1.1−CD3+ T cells (E), Lin−CD11b+Ly6G+ neutrophils (F), CD3−CD19−NK1.1+ NK cells (G), Lin−CD11cintPDCA-1+ pDCs (H), and Lin−Flt3−CD11b+Ly6G−CD115+ monocytes (I) in PBS- or DT-treated steady-state zDC-DTR bone marrow chimeras. Results represent three to four experiments. (J) Lin−CD11b+Ly6G−CD11c+Ly6C+ activated monocytes in PBS- or DT-treated _L. monocytogenes_–infected zDC-DTR bone marrow chimeras. Graphs on the right show percentage of indicated population in DT-treated WT, zDC-DTR, and CD11c-DTR bone marrow chimeras with each point representing one mouse and horizontal lines showing the mean per group.
Figure 4.
CD11c+CD14+ cells in skLNs derive from cDCs. (A and B) CD11c+MHCII+CD14+ cells in skLN (A) and Lin−Flt3−CD11b+Ly6G−CD115+ monocytes (B) in blood 24 h after PBS or LPS injection in WT and Flt3L−/− mice. Graphs on the right summarize three experiments, with each point representing one mouse and the horizontal bars showing the mean. (C) CD11c+MHCII+CD14+ cells in skLN 24 h after LPS injection in PBS- or DT-treated zDC-DTR bone marrow chimeras. (D) CD45.1+ WT versus CD45.2+ zDC-DTR contribution to CD11c+MHCII+CD14+ cells in skLN 24 h after LPS treatment in PBS- or DT-treated WT:zDC-DTR mixed bone marrow chimeras. Error bars indicate SEM.
Figure 5.
Macrophage populations in the spleen and skLNs are intact after DT injection in zDC-DTR mice. (A) Splenic Lin−CD11cintCD11bloF4/80+ red pulp macrophages measured by flow cytometry in PBS- or DT-treated zDC-DTR bone marrow chimeras. Results are representative of three independent experiments with each point on the graph representing one mouse and the horizontal bars representing the means. (B–E) Spleen and skLNs from DT-treated WT, zDC-DTR, and CD11c-DTR mice were stained with B220 (green) to visualize B cell zones and appropriate macrophage markers (red). Bars, 100 µm. In the spleen, F4/80 identifies red pulp macrophages (B) and CD169+ marginal zone macrophages (C) which outline B cell zones. (D) F4/80+ medullar macrophages in the skLN. Diagram of LN included with merged image to represent region of LN imaged (dashed box) relative to entire LN (solid outline). (E) CD169+ subcapsular sinus macrophages located on the outer border of LN sections. Images represent results from three independent sets of experiments.
Figure 6.
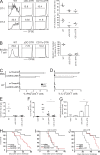
Comparison of DT treatment in zDC- and CD11c-DTR bone marrow chimeras during immune responses. (A) CFSE-labeled CD45.1+ OT-I and OT-II cells were transferred into CD45.2+ recipients, treated with DT 24 h later, and injected with 20 µg OVA i.v. another 24 h later. CFSE dilution of CD45.1+ OT-I and OT-II cells was measured by flow cytometry 3 d after OVA injection. These experiments were repeated twice with two to three mice per group per experiment. The horizontal bar shows the mean per group. (B) 500,000 bulk splenocytes from DT-treated CD45.2+ C57BL/6 bone marrow chimeras were co-cultured with 50,000 CFSE-labeled CD45.1+ BALB/c T cells. CFSE dilution of CD45.1+ BALB/c T cells was measured by flow cytometry after 5 d. Results represent three experiments with two mice per group per experiment. The horizontal bar shows the mean per group. (C and D) PBS- and DT-treated zDC-DTR bone marrow chimeras were immunized with poly I:C plus α-CD40 and α-DEC-205-GAGp24 or α-Treml4-GAGp24, and IFN-γ and IL-2 production by splenic CD3+CD4+ T cells was measured after restimulation in vitro with p24 or p17 control peptide. This was repeated twice with four to five mice per group per experiment. Error bars indicate SEM. (E–G) Mice were treated with DT before infection with 15 T. gondii cysts by gavage and DT ablation was maintained until 8 d after infection when mice were euthanized. (E) The abundance of Lin−CD11chi cDCs in the spleens from DT-treated T. gondii_–infected WT, zDC-DTR, and CD11c-DTR bone marrow chimeras determined by flow cytometry. (F) The percentage of CD3+CD4+ T cells producing IFN-γ in the mLN quantified by intracellular cytokine staining after restimulation in vitro._ Uninfected mice were included as naive controls. Statistical significance was determined using a Student’s t test. Results were pooled from three experiments with two to three mice per group per experiment. The horizontal bar shows the mean of each group. (G) Q-PCR of whole lung cDNA for T. gondii tachyzoite-specific SAG2 expression normalized to GAPDH. Uninfected mice were included as naive controls. ND indicates not detected. Error bars indicate SEM. Statistical significance was determined by Student’s t test: *, P < 0.01; **, P < 0.005. (H and I) Mice were injected with DT before i.v. immunization with Ad-OVA plus poly I:C and α-CD40, and DT ablation was maintained for 15 d. 1 mo after immunization, mice were challenged with 105 MO4 cells i.v. and followed for survival. Each group contained 5–10 mice per group per experiment and was repeated three times. (J) As in H, but immunization was with 20 × 106 irradiated MO4 melanoma cells (7,500 rad) plus poly I:C and α-CD40, and challenge was with 105 MO4 cells s.c. 1 mo later. The experiment was repeated twice with five mice per group per experiment.
Similar articles
- Zbtb46 expression distinguishes classical dendritic cells and their committed progenitors from other immune lineages.
Satpathy AT, KC W, Albring JC, Edelson BT, Kretzer NM, Bhattacharya D, Murphy TL, Murphy KM. Satpathy AT, et al. J Exp Med. 2012 Jun 4;209(6):1135-52. doi: 10.1084/jem.20120030. Epub 2012 May 21. J Exp Med. 2012. PMID: 22615127 Free PMC article. - Zinc finger transcription factor zDC is a negative regulator required to prevent activation of classical dendritic cells in the steady state.
Meredith MM, Liu K, Kamphorst AO, Idoyaga J, Yamane A, Guermonprez P, Rihn S, Yao KH, Silva IT, Oliveira TY, Skokos D, Casellas R, Nussenzweig MC. Meredith MM, et al. J Exp Med. 2012 Aug 27;209(9):1583-93. doi: 10.1084/jem.20121003. Epub 2012 Jul 30. J Exp Med. 2012. PMID: 22851594 Free PMC article. - Inducible targeting of cDCs and their subsets in vivo.
Loschko J, Rieke GJ, Schreiber HA, Meredith MM, Yao KH, Guermonprez P, Nussenzweig MC. Loschko J, et al. J Immunol Methods. 2016 Jul;434:32-8. doi: 10.1016/j.jim.2016.04.004. Epub 2016 Apr 9. J Immunol Methods. 2016. PMID: 27073171 Free PMC article. - Classical dendritic cells as a unique immune cell lineage.
Reizis B. Reizis B. J Exp Med. 2012 Jun 4;209(6):1053-6. doi: 10.1084/jem.20121038. J Exp Med. 2012. PMID: 22665701 Free PMC article. Review. - Development, Diversity, and Function of Dendritic Cells in Mouse and Human.
Anderson DA 3rd, Murphy KM, Briseño CG. Anderson DA 3rd, et al. Cold Spring Harb Perspect Biol. 2018 Nov 1;10(11):a028613. doi: 10.1101/cshperspect.a028613. Cold Spring Harb Perspect Biol. 2018. PMID: 28963110 Free PMC article. Review.
Cited by
- Type 17 immunity: novel insights into intestinal homeostasis and autoimmune pathogenesis driven by gut-primed T cells.
Ohara D, Takeuchi Y, Hirota K. Ohara D, et al. Cell Mol Immunol. 2024 Nov;21(11):1183-1200. doi: 10.1038/s41423-024-01218-x. Epub 2024 Oct 8. Cell Mol Immunol. 2024. PMID: 39379604 Free PMC article. Review. - Classical dendritic cells contribute to hypoxia-induced pulmonary hypertension.
Mickael C, Sanders LA, Lee MH, Kumar R, Fonseca-Balladares D, Gandjeva A, Cautivo-Reyes K, Kassa B, Kumar S, Irwin D, Swindle D, Phang T, Stearman RS, Molofsky AB, McKee AS, Stenmark KR, Graham BB, Tuder RM. Mickael C, et al. FASEB J. 2024 Aug 31;38(16):e70015. doi: 10.1096/fj.202400338RR. FASEB J. 2024. PMID: 39212294 - Crucial role of dendritic cells in the generation of anti-tumor T-cell responses and immunogenic tumor microenvironment to suppress tumor development.
Tominaga M, Uto T, Fukaya T, Mitoma S, Riethmacher D, Umekita K, Yamashita Y, Sato K. Tominaga M, et al. Front Immunol. 2024 Aug 14;15:1200461. doi: 10.3389/fimmu.2024.1200461. eCollection 2024. Front Immunol. 2024. PMID: 39206204 Free PMC article. - Evaluating in vivo approaches for studying the roles of thymic DCs in T cell development in mice.
Wang Y, Chong MMW. Wang Y, et al. Front Immunol. 2024 Aug 6;15:1451974. doi: 10.3389/fimmu.2024.1451974. eCollection 2024. Front Immunol. 2024. PMID: 39165362 Free PMC article. Review. - ZBTB46 coordinates angiogenesis and immunity to control tumor outcome.
Kabir AU, Zeng C, Subramanian M, Wu J, Kim M, Krchma K, Wang X, Halabi CM, Pan H, Wickline SA, Fremont DH, Artyomov MN, Choi K. Kabir AU, et al. Nat Immunol. 2024 Sep;25(9):1546-1554. doi: 10.1038/s41590-024-01936-4. Epub 2024 Aug 12. Nat Immunol. 2024. PMID: 39134750
References
- Bradford B.M., Sester D.P., Hume D.A., Mabbott N.A.. 2011. Defining the anatomical localisation of subsets of the murine mononuclear phagocyte system using integrin alpha X (Itgax, CD11c) and colony stimulating factor 1 receptor (Csf1r, CD115) expression fails to discriminate dendritic cells from macrophages. Immunobiology. 216:1228–1237. 10.1016/j.imbio.2011.08.006 - DOI - PubMed
Publication types
MeSH terms
Substances
Grants and funding
- P30 AR044535/AR/NIAMS NIH HHS/United States
- HHMI/Howard Hughes Medical Institute/United States
- AI051573/AI/NIAID NIH HHS/United States
- P30AR044535/AR/NIAMS NIH HHS/United States
- P01 AI051573/AI/NIAID NIH HHS/United States
- T32 GM007739/GM/NIGMS NIH HHS/United States
LinkOut - more resources
Full Text Sources
Other Literature Sources
Molecular Biology Databases
Research Materials


