TGF-β signaling to T cells inhibits autoimmunity during lymphopenia-driven proliferation - PubMed (original) (raw)
TGF-β signaling to T cells inhibits autoimmunity during lymphopenia-driven proliferation
Nu Zhang et al. Nat Immunol. 2012.
Abstract
T cell-specific deletion of the receptor for transforming growth factor-β (TGF-β) mediated by Cre recombinase expressed early in T cell development leads to early-onset lethal autoimmune disease that cannot be controlled by regulatory T cells. However, when we deleted that receptor through the use of Cre driven by a promoter that is active much later in T cell development, adult mice in which most peripheral CD4(+) or CD8(+) T cells lacked the receptor for TGF-β showed no signs of autoimmunity. Because of their enhanced responses to weak stimulation of the T cell antigen receptor, when transferred into lymphopenic recipients, naive TGF-β-unresponsive T cells underwent much more proliferation and differentiation into effector cells and induced lymphoproliferative disease. We propose that TGF-β signaling controls the self-reactivity of peripheral T cells but that in the absence of TGF-β signals, an added trigger such as lymphopenia is needed to drive overt autoimmune disease.
Figures
Figure 1. Characterization of T cells in adult TGF-βRII KO mice
Mice with floxed alleles of TGF-βRII were bred to dLck-cre transgenic mice and examined at 7–9 weeks of age. (a) Surface staining for TGF-βRII and CD103 on gated splenic CD4+ and CD8+ T cells. (b) Splenic CD4+ and CD8+ T cells were stained for CD44 and CD62L. Numbers represent the percentage of cells falling in each quadrant. (c) Intracellular staining for T-bet in total and naive CD44loCD62L+ phenotype CD4+ and CD8+ T cells.
Figure 2. Dramatically increased lymphopenia induced proliferation of TGF-βRII KO T cells in _Rag1_−/− mice
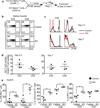
(a) Schematic of the experiment. Naive T cells were purified from control (CD45.1) and KO (CD45.2) mice, mixed at a 1:1 ratio and CFSE labeled. 1×10⁶ cells were transferred into sex-matched _Rag1_−/− recipient mice. 5.5 and 7 days later, recipient mice were sacrificed. (b) Purified naive CD4+ and CD8+ T cells were stained for CD44 and CD62L. (c) Representative CFSE profile of donor T cells in the spleen. (d) Relative KO T cell number was calculated for splenic CD4+ and CD8+ T cells separately. (e) The percentage of KLRG1+, Granzyme B+ and IFN-γ+ cells in the spleen was plotted for donor T cells. Each point represents an individual recipient mouse (* p<0.05 and ** p<0.01). Representative data from two independent experiments are shown.
Figure 3. TGF-βRII KO T cells induce lymphoproliferative disease in _Rag1_−/− recipient mice
1.5×10⁶ naive T cells from control or KO mice were transferred separately into _Rag1_−/− recipient mice. (a) Recipient mice were weighed every week after T cell transfer (n=10 for both control and KO groups). (b) 5 weeks post transfer, spleen, lamina propria and liver lymphocytes of the recipient mice were analyzed by flow cytometry. CD4+ and CD8+ T cell number was calculated from the total cellularity and the percentage of T cells in each organ. Each point represents an individual recipient mouse (**p<0.01). Representative data from two independent experiments are shown.
Figure 4. Dramatically increased lymphopenia induced proliferation of TGF-βRII KO T cells in sublethally irradiated B6 mice
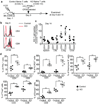
(a) Schematic of the experiment. Sex-matched recipient B6 mice were irradiated at 6.5G. On the following day, naive T cells were purified from control (CD45.1) and KO (CD45.1+CD45.2+) mice, mixed at a 1:1 ratio and CFSE labeled. 1×10⁶ cells were transferred. 8 (b) and 14 (c and d) days later, recipient mice were sacrificed. (b) Representative CFSE profile of donor T cells in the spleen. (c) Relative KO T cell number was calculated for CD4+ and CD8+ T cells separately. (d) The percentage of IFN-γ+, KLRG1+, Granzyme B+, T-bet+ and Eomes+ cells in the spleen was plotted for donor T cells (** p<0.01). Each point represents an individual recipient mouse.
Figure 5. In vitro hyperproliferative response of TGF-βRII KO CD8+ T cells to weak stimulation
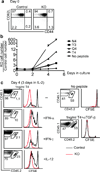
Equal numbers of naive OT-1 cells from control (CD45.1+CD45.2+) and KO (CD45.1) mice were mixed and CFSE labeled. T cell and NK cell depleted splenocytes (as APCs) from B6 (CD45.2) mice were incubated with 1 ng/ml of Ova peptide variants (N4, Y3, Q4, T4) plus 1 µg/ml LPS at 37°C for 1 hour. After extensive washing, an equal number of APCs and OT-1 T cells were mixed in the presence of 2.5 ng/ml hTGF-β1 with or without inflammatory cytokines (1000U/ml IFN-α, 20ng/ml IFN-γ or 20ng/ml IL-12). 50U/ml IL-2 was added one day later. (a) Starting population of mixed control and KO OT-1 T cells. (b) Relative KO OT-1 T cell number in the absence of inflammatory cytokines. (c) Flow cytometry profiles of T4 peptide-stimulated OT-1 T cells after a 4 day in vitro culture. 10 µg/ml αTGF-β neutralizing antibody was added during the culture as shown in the lower right panels. Representative data from three independent experiments are shown.
Figure 6. In vitro hyperproliferative response of WT CD8+ T cells to weak stimulation in the absence of TGF-β
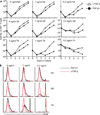
Naive OT-1 cells from WT (CD45.1) mice were purified and CFSE labeled. T cell and NK cell depleted splenocytes (APCs) from B6 (CD45.2) mice were incubated with indicated concentration of Ova peptide variants plus 1 µg/ml LPS at 37°C for 1 hour. After extensive washing, 105 APCs and OT-1 T cells were mixed in the presence of 2.5 ng/ml hTGF-β1 or 10 µg/ml αTGF-β neutralizing antibody. 50U/ml IL-2 was added one day later. (a) Numbers of live OT-1 cells under each condition were determined everyday by flow cytometry with the addition of count standard beads. (b) CFSE profile of OT-1 cells after a 4 day in vitro culture. Representative data from two independent experiments are shown.
Figure 7. TGF-βRII KO CD4+ T cells induce autoimmune disease in _Rag1_−/− mice whereas KO CD8+ T cells only do so in the presence of CD4+ T cells
(a) Schematic of the experiment. 1×10⁶ naive CD4+ or CD8+ T cells from control or KO mice were transferred into _Rag1_−/− recipient mice that were examined 5–7 weeks later. (b) Donor T cell number was calculated from the total cellularity and the percentage of each population in spleen and lamina propria. (c) and (d) Body weight was examined every week for the _Rag1_−/− mice receiving CD4+ T cells (c) and CD8+ T cells with or without CD4+ T cells (d). Each line represents an individual recipient mouse.
Comment in
- TGF-β puts the brakes on homeostatic proliferation.
Surh CD, Sprent J. Surh CD, et al. Nat Immunol. 2012 Jun 19;13(7):628-30. doi: 10.1038/ni.2345. Nat Immunol. 2012. PMID: 22713819 No abstract available. - Suppressing autoimmunity by TGF-β: not just through T(reg) cells.
He MX, He YW. He MX, et al. Cell Mol Immunol. 2012 Sep;9(5):371-2. doi: 10.1038/cmi.2012.24. Epub 2012 Aug 13. Cell Mol Immunol. 2012. PMID: 22885526 Free PMC article. No abstract available. - A two-hit model of autoimmunity: lymphopenia and unresponsiveness to TGF-β signaling.
L'Huillier A, Ren G, Shi Y, Zhang J. L'Huillier A, et al. Cell Mol Immunol. 2012 Sep;9(5):369-70. doi: 10.1038/cmi.2012.25. Epub 2012 Aug 13. Cell Mol Immunol. 2012. PMID: 22885528 Free PMC article. No abstract available.
Similar articles
- TGF-β signalling is required for CD4⁺ T cell homeostasis but dispensable for regulatory T cell function.
Sledzińska A, Hemmers S, Mair F, Gorka O, Ruland J, Fairbairn L, Nissler A, Müller W, Waisman A, Becher B, Buch T. Sledzińska A, et al. PLoS Biol. 2013 Oct;11(10):e1001674. doi: 10.1371/journal.pbio.1001674. Epub 2013 Oct 8. PLoS Biol. 2013. PMID: 24115907 Free PMC article. - A two-hit model of autoimmunity: lymphopenia and unresponsiveness to TGF-β signaling.
L'Huillier A, Ren G, Shi Y, Zhang J. L'Huillier A, et al. Cell Mol Immunol. 2012 Sep;9(5):369-70. doi: 10.1038/cmi.2012.25. Epub 2012 Aug 13. Cell Mol Immunol. 2012. PMID: 22885528 Free PMC article. No abstract available. - Truncated form of TGF-βRII, but not its absence, induces memory CD8+ T cell expansion and lymphoproliferative disorder in mice.
Ishigame H, Mosaheb MM, Sanjabi S, Flavell RA. Ishigame H, et al. J Immunol. 2013 Jun 15;190(12):6340-50. doi: 10.4049/jimmunol.1300397. Epub 2013 May 17. J Immunol. 2013. PMID: 23686479 Free PMC article. - TGF-beta: receptors, signaling pathways and autoimmunity.
Chen W, Wahl SM. Chen W, et al. Curr Dir Autoimmun. 2002;5:62-91. doi: 10.1159/000060548. Curr Dir Autoimmun. 2002. PMID: 11826761 Review. No abstract available. - Lymphopenia and autoimmunity: A double-edged sword.
Merayo-Chalico J, Rajme-López S, Barrera-Vargas A, Alcocer-Varela J, Díaz-Zamudio M, Gómez-Martín D. Merayo-Chalico J, et al. Hum Immunol. 2016 Oct;77(10):921-929. doi: 10.1016/j.humimm.2016.06.016. Epub 2016 Jun 22. Hum Immunol. 2016. PMID: 27343993 Review.
Cited by
- Multi-armored allogeneic MUC1 CAR T cells enhance efficacy and safety in triple-negative breast cancer.
Erler P, Kurcon T, Cho H, Skinner J, Dixon C, Grudman S, Rozlan S, Dessez E, Mumford B, Jo S, Boyne A, Juillerat A, Duchateau P, Poirot L, Aranda-Orgilles B. Erler P, et al. Sci Adv. 2024 Aug 30;10(35):eadn9857. doi: 10.1126/sciadv.adn9857. Epub 2024 Aug 30. Sci Adv. 2024. PMID: 39213364 Free PMC article. - T-bet deficiency and Hic1 induction override TGF-β-dependency in the formation of CD103+ intestine-resident memory CD8+ T cells.
Wang L, Mishra S, Fan KK, Quon S, Li G, Yu B, Liao W, Liu Y, Zhang X, Qiu Y, Li Y, Goldrath AW, Ma C, Zhang N. Wang L, et al. Cell Rep. 2024 Jun 25;43(6):114258. doi: 10.1016/j.celrep.2024.114258. Epub 2024 May 22. Cell Rep. 2024. PMID: 38781073 Free PMC article. - ECSIT facilitates memory CD8+ T cell development by mediating fumarate synthesis during viral infection and tumorigenesis.
Yang Y, Wang Y, Wang Z, Yan H, Gong Y, Hu Y, Jiang Y, Wen S, Xu F, Wang B, Humphries F, Chen Y, Wang X, Yang S. Yang Y, et al. Nat Cell Biol. 2024 Mar;26(3):450-463. doi: 10.1038/s41556-024-01351-9. Epub 2024 Feb 7. Nat Cell Biol. 2024. PMID: 38326554 - DIALing-up the preclinical characterization of gene-modified adoptive cellular immunotherapies.
Giardino Torchia ML, Moody G. Giardino Torchia ML, et al. Front Immunol. 2023 Nov 28;14:1264882. doi: 10.3389/fimmu.2023.1264882. eCollection 2023. Front Immunol. 2023. PMID: 38090585 Free PMC article. Review. - TGF-β broadly modifies rather than specifically suppresses reactivated memory CD8 T cells in a dose-dependent manner.
Taber A, Konecny A, Oda SK, Scott-Browne J, Prlic M. Taber A, et al. Proc Natl Acad Sci U S A. 2023 Nov 28;120(48):e2313228120. doi: 10.1073/pnas.2313228120. Epub 2023 Nov 21. Proc Natl Acad Sci U S A. 2023. PMID: 37988468 Free PMC article.
References
- Li MO, Wan YY, Sanjabi S, Robertson AK, Flavell RA. Transforming growth factor-beta regulation of immune responses. Annu Rev Immunol. 2006;24:99–146. - PubMed
- Blobe GC, Schiemann WP, Lodish HF. Role of transforming growth factor beta in human disease. N Engl J Med. 2000;342:1350–1358. - PubMed
- Hill CS. Nucleocytoplasmic shuttling of Smad proteins. Cell Res. 2009;19:36–46. - PubMed
Publication types
MeSH terms
Substances
Grants and funding
- HHMI_/Howard Hughes Medical Institute/United States
- P30 CA015704/CA/NCI NIH HHS/United States
- R01 AI019335/AI/NIAID NIH HHS/United States
- AI19335/AI/NIAID NIH HHS/United States
LinkOut - more resources
Full Text Sources
Other Literature Sources
Molecular Biology Databases
Research Materials
Miscellaneous


