Nuclear factor of activated T-cell c3 inhibition of mammalian target of rapamycin signaling through induction of regulated in development and DNA damage response 1 in human intestinal cells - PubMed (original) (raw)
Nuclear factor of activated T-cell c3 inhibition of mammalian target of rapamycin signaling through induction of regulated in development and DNA damage response 1 in human intestinal cells
Yuning Zhou et al. Mol Biol Cell. 2012 Aug.
Abstract
The nuclear factor of activated T-cell (NFAT) proteins are a family of transcription factors (NFATc1-c4) involved in the regulation of cell differentiation. We identified REDD1, a negative regulator of mammalian target of rapamycin (mTOR) through the tuberous sclerosis complex (TSC1/2 complex), as a new molecular target of NFATc3. We show that treatment with a combination of phorbol 12-myristate 13-acetate (PMA) plus ionophore A23187 (Io), which induces NFAT activation, increased REDD1 mRNA and protein expression and inhibited mTOR signaling; pretreatment with the calcineurin inhibitor cyclosporin A (CsA), an antagonist of NFAT signaling, decreased REDD1 induction and mTOR inhibition. Knockdown of NFATc3, not NFATc1, NFATc2, or NFATc4, attenuated PMA/Io-induced REDD1 expression. Treatment with PMA/Io increased REDD1 promoter activity and increased NFATc3 binding to the REDD1 promoter. Overexpression of NFATc3 increased REDD1 mRNA and protein expression and increased PMA/Io-mediated REDD1 promoter activity. Treatment with PMA/Io increased expression of the goblet cell differentiation marker MUC2; these changes were attenuated by pretreatment with CsA or knockdown of REDD1 or NFATc3. Overexpression of NFATc3 increased, while knockdown of TSC2 decreased, MUC2 expression. We provide evidence showing NFATc3 inhibits mTOR via induction of REDD1. Our results suggest a role for the NFATc3/REDD1/TSC2 axis in the regulation of intestinal cell differentiation.
Figures
FIGURE 1:
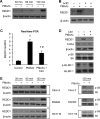
PMA/Io-mediated induction of REDD1 expression was attenuated by CsA, a potent calcineurin inhibitor in intestinal cells. (A) HT29 cells were treated with PMA (100 nM) plus Io (2.5 μM) over a time course. Total protein was extracted from cells, resolved by SDS–PAGE, transferred to a PVDF membrane, and probed with anti-REDD1 and anti–β-actin antibodies. (B) HT29 cells were pretreated with actinomycin D (10 μg/ml) for 30 min; this was followed by treatment with a combination of PMA (100 nM) plus Io (2.5 μM) with actinomycin D (10 μg/ml) for 1.5 h. (C) HT29 cells were pretreated with CsA for 30 min; this was followed by treatment with a combination of PMA (100 nM) plus Io (2.5 μM) with CsA for 1.5 h. Total RNA was extracted, and REDD1 mRNA levels were determined by real-time RT-PCR. (Data represent mean ± SD; *, p < 0.01 vs. control; #, p < 0.01 vs. PMA/Io alone as determined by ANOVA.) (D) HT29 cells were pretreated with CsA for 30 min; this was followed by treatment with a combination of PMA (100 nM) plus Io (2.5 μM) with CsA for 1.5 h. Total protein was extracted from cells, resolved by SDS–PAGE, and subjected to Western blotting using anti-REDD1, anti–c-Myc, anti–phospho-S6 (pS235/236), anti-S6, anti–phospho-4E-BP-1 (pT37/46), anti–4E-BP-1 and anti–β-actin antibodies. (E) Caco-2, SW480, and HCT116 cells were treated with PMA (100 nM) plus Io (2.5 μM) over a time course. Total protein was extracted from cells, resolved by SDS–PAGE, transferred to a PVDF membrane, and probed with anti-REDD1, anti–β-actin, anti–phospho-S6, and anti-S6 antibodies.
FIGURE 2:
Knockdown of NFATc3-attenuated PMA/Io induced REDD1 expression in HT29 cells. (A) HT29 cells were transfected with control siRNA or siRNA specifically targeting NFATc1, c2, c3, or c4. After a 46-h incubation, transfected cells were treated with PMA (100 nM) plus Io (2.5 μM) for an additional 1.5 h. Cells were lysed, and Western blot analysis was performed using antibodies against REDD1 and β-actin. (B) HT29 cells were transfected with control siRNA or siRNA targeting NFATc1, c2, c3, or c4. After a 46-h incubation, total RNA was extracted, and real-time RT-PCR was performed for analysis of NFATc1, NFATc2, NFATc3, and NFATc4 mRNA expression. (Data represent mean ± SD; *p < 0.01 vs control as determined by two-sample t tests.) (C) HT29 cells were transfected with control siRNA or siRNA targeting NFATc1, c2, c3, or c4. After a 46-h incubation, total protein was extracted, and Western blotting was performed for analysis of NFATc1, NFATc2, NFATc3, and NFATc4 protein expression.
FIGURE 3:
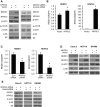
NFATc3 regulated REDD1 expression in HT29, Caco-2, HCT116, and SW480 cells. (A) HT29 cells were transfected with control vector or NFATc3 (left) or control siRNA or siRNA targeting NFATc3 (right). After a 48-h incubation, REDD1, NFATc3, β-actin, phospho-mTOR (pS2448), mTOR, phospho-S6 (pS235/236), and S6 expression was determined by Western blotting. (B and C) HT29 cells were transfected with control vector or NFATc3 plasmid (B) or transfected with control siRNA or siRNA targeting NFATc3 (C). After a 48-h incubation, total RNA was extracted and REDD1 and NFATc3 mRNA levels were determined by real-time RT-PCR. (Data represent mean ± SD; *p < 0.01 vs. control as determined by two-sample t tests.) (D and E) Caco-2, HCT116, and SW480 cells were transfected with control vector or NFATc3 (D) or transfected with control siRNA or siRNA targeting NFATc3 (E). After a 48-h incubation, REDD1, NFATc3, β-actin, phospho-S6 (pS235/236), and S6 expression was determined by Western blotting.
FIGURE 4:
NFATc3 is a transcriptional activator of REDD1 in HT29 cells. (A and B) HT29 cells were transfected with a construct containing REDD1 promoter sequence (−2931/−97) alone (A) or together with either control plasmid or an NFATc3 plasmid (B). At 43-h posttransfection, cells were treated with or without PMA/Io for 5 h. Cells were harvested, and luciferase activity was assayed. All results were normalized for transfection efficiency using the pRL-Tk-luc plasmid (Promega). (Data shown are mean ± SD; *p < 0.05, PMA/Io vs. control, or NFATc3 alone or PMA/Io plus vector vs. vector alone; #, p < 0.05, PMA/Io plus CsA vs. control or PMA/Io plus NFATc3 vs. NFATc3 alone, as determined by ANOVA.) (C) HT29 cells were subjected to ChIP assay; soluble chromatin was prepared from HT29 cells treated with PMA/Io for 1 h and immunoprecipitated with NFATc3 antibody or IgG. Total (Input) and immunoprecipitated DNAs or H2O (negative control) were then PCR-amplified using primer pairs covering −890/−97 within the human REDD1 promoter.
FIGURE 5:
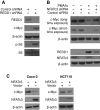
NFATc3/REDD1 regulation of c-Myc expression. (A) Total protein from HT29 cells stably transfected with control or REDD1 shRNA was extracted and analyzed by Western blotting using anti-REDD1, anti-S6, anti–phospho-S6 (pS235/236), and anti–β-actin antibodies. (B) HT29 cells were transfected with control siRNA or siRNA targeting NFATc3. After a 46.5-h incubation, transfected cells were treated with PMA (100 nM) plus Io (2.5 μM) for an additional 1.5 h. Cells were lysed, and Western blot analysis was performed using antibodies against c-Myc, REDD1, NFATc3, and β-actin. (C) Caco-2 and HCT116 cells were transfected with control vector or NFATc3 plasmid. After a 48-h incubation, c-Myc and NFATc3 expression was determined by Western blotting. β-actin was blotted to confirm equal loading.
FIGURE 6:
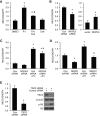
NFATc3 and REDD1 regulation of MUC2 mRNA expression. (A) HT29 cells were pretreated with CsA for 30 min; this was followed by treatment with the combination of PMA/Io for 1.5 h. (B) HT29 cells were transfected with control siRNA or siRNA targeting NFATc3 (left panel) or transfected with control vector or NFATc3 plasmid (right panel). Transfected cells were incubated for 48 h. (C) HT29 cells were transfected with control siRNA or siRNA targeting NFATc3. After a 46-h incubation, transfected cells were treated with PMA/Io for an additional 1.5 h. (D) HT29 cells, stably transfected with control or REDD1 shRNA, were treated with PMA/Io for 1.5 h. (E) HT29 cells were transfected with control siRNA or siRNA targeting TSC2 and incubated for 48 h. Total RNA was extracted, and MUC2 mRNA levels were determined by real-time RT-PCR (A–E). (Data represent mean ± SD; *p < 0.01 vs. control or control siRNA or control shRNA or vector alone; #p < 0.01 vs. PMA/Io alone as determined by ANOVA.) Total protein was extracted and subjected to Western blotting using anti-TSC2, anti–phospho-S6 (pS235/236), anti-S6, and anti–β-actin antibodies (E).
Similar articles
- NFATc1 regulation of TRAIL expression in human intestinal cells.
Wang Q, Zhou Y, Weiss HL, Chow CW, Evers BM. Wang Q, et al. PLoS One. 2011;6(5):e19882. doi: 10.1371/journal.pone.0019882. Epub 2011 May 16. PLoS One. 2011. PMID: 21603612 Free PMC article. - Nuclear factor of activated T-cells 5 increases intestinal goblet cell differentiation through an mTOR/Notch signaling pathway.
Zhou Y, Wang Q, Weiss HL, Evers BM. Zhou Y, et al. Mol Biol Cell. 2014 Sep 15;25(18):2882-90. doi: 10.1091/mbc.E14-05-0998. Epub 2014 Jul 23. Mol Biol Cell. 2014. PMID: 25057011 Free PMC article. - Nuclear factor of activated T cells (NFAT) signaling regulates PTEN expression and intestinal cell differentiation.
Wang Q, Zhou Y, Jackson LN, Johnson SM, Chow CW, Evers BM. Wang Q, et al. Mol Biol Cell. 2011 Feb 1;22(3):412-20. doi: 10.1091/mbc.E10-07-0598. Epub 2010 Dec 9. Mol Biol Cell. 2011. PMID: 21148296 Free PMC article. - Growth control under stress: mTOR regulation through the REDD1-TSC pathway.
Ellisen LW. Ellisen LW. Cell Cycle. 2005 Nov;4(11):1500-02. doi: 10.4161/cc.4.11.2139. Epub 2005 Nov 1. Cell Cycle. 2005. PMID: 16258273 Review. - The stress-responsive protein REDD1 and its pathophysiological functions.
Kim JY, Kwon YG, Kim YM. Kim JY, et al. Exp Mol Med. 2023 Sep;55(9):1933-1944. doi: 10.1038/s12276-023-01056-3. Epub 2023 Sep 1. Exp Mol Med. 2023. PMID: 37653030 Free PMC article. Review.
Cited by
- Mechanisms driving fasting-induced protection from genotoxic injury in the small intestine.
Deans-Fielder K, Wu T, Nguyen T, To S, Huang YZ, Bark SJ, Mills JC, Shroyer NF. Deans-Fielder K, et al. Am J Physiol Gastrointest Liver Physiol. 2024 May 1;326(5):G504-G524. doi: 10.1152/ajpgi.00126.2023. Epub 2024 Feb 13. Am J Physiol Gastrointest Liver Physiol. 2024. PMID: 38349111 - Monocarboxylate Transporter 4 Triggered Cell Pyroptosis to Aggravate Intestinal Inflammation in Inflammatory Bowel Disease.
Wang Y, Zhou X, Zou K, Chen G, Huang L, Yang F, Pan W, Xu H, Xu Z, Chen H, Chen J, Gong S, Zhou X, Xu W, Zhao J. Wang Y, et al. Front Immunol. 2021 May 19;12:644862. doi: 10.3389/fimmu.2021.644862. eCollection 2021. Front Immunol. 2021. PMID: 34093533 Free PMC article. - Spectrum of Somatic Cancer Gene Variations Among Adults With Appendiceal Cancer by Age at Disease Onset.
Holowatyj AN, Eng C, Wen W, Idrees K, Guo X. Holowatyj AN, et al. JAMA Netw Open. 2020 Dec 1;3(12):e2028644. doi: 10.1001/jamanetworkopen.2020.28644. JAMA Netw Open. 2020. PMID: 33295976 Free PMC article. - NFATc3 regulation of collagen V expression contributes to cellular immunity to collagen type V and hypoxic pulmonary hypertension.
Sheak JR, Jones DT, Lantz BJ, Maston LD, Vigil D, Resta TC, Resta MM, Howard TA, Kanagy NL, Guo Y, Jankowska-Gan E, Sullivan JA, Braun RK, Burlingham WJ, Gonzalez Bosc LV. Sheak JR, et al. Am J Physiol Lung Cell Mol Physiol. 2020 Dec 1;319(6):L968-L980. doi: 10.1152/ajplung.00184.2020. Epub 2020 Sep 30. Am J Physiol Lung Cell Mol Physiol. 2020. PMID: 32997513 Free PMC article. - NFATc3 plays an oncogenic role in oral/oropharyngeal squamous cell carcinomas by promoting cancer stemness via expression of OCT4.
Lee SH, Kieu C, Martin CE, Han J, Chen W, Kim JS, Kang MK, Kim RH, Park NH, Kim Y, Shin KH. Lee SH, et al. Oncotarget. 2019 Mar 19;10(23):2306-2319. doi: 10.18632/oncotarget.26774. eCollection 2019 Mar 19. Oncotarget. 2019. PMID: 31040921 Free PMC article.
References
- Corradetti MN, Inoki K, Guan KL. The stress-inducted proteins RTP801 and RTP801L are negative regulators of the mammalian target of rapamycin pathway. J Biol Chem. 2005;280:9769–9772. - PubMed
- de la Pompa JL, et al. Role of the NF-ATc transcription factor in morphogenesis of cardiac valves and septum. Nature. 1998;392:182–186. - PubMed
- Duque J, Fresno M, Iniguez MA. Expression and function of the nuclear factor of activated T cells in colon carcinoma cells: involvement in the regulation of cyclooxygenase-2. J Biol Chem. 2005;280:8686–8693. - PubMed
Publication types
MeSH terms
Substances
LinkOut - more resources
Full Text Sources
Miscellaneous


