Quercetin and allopurinol ameliorate kidney injury in STZ-treated rats with regulation of renal NLRP3 inflammasome activation and lipid accumulation - PubMed (original) (raw)
Quercetin and allopurinol ameliorate kidney injury in STZ-treated rats with regulation of renal NLRP3 inflammasome activation and lipid accumulation
Chuang Wang et al. PLoS One. 2012.
Abstract
Hyperuricemia, hyperlipidemia and inflammation are associated with diabetic nephropathy. The NLRP3 inflammasome-mediated inflammation is recently recognized in the development of kidney injury. Urate and lipid are considered as danger signals in the NLRP3 inflammasome activation. Although dietary flavonoid quercetin and allopurinol alleviate hyperuricemia, dyslipidmia and inflammation, their nephroprotective effects are currently unknown. In this study, we used streptozotocin (STZ)-induced diabetic nephropathy model with hyperuricemia and dyslipidemia in rats, and found over-expression of renal inflammasome components NLRP3, apoptosis-associated speck-like protein and Caspase-1, resulting in elevation of IL-1β and IL-18, with subsequently deteriorated renal injury. These findings demonstrated the possible association between renal NLRP3 inflammasome activation and lipid accumulation to superimpose causes of nephrotoxicity in STZ-treated rats. The treatment of quercetin and allopurinol regulated renal urate transport-related proteins to reduce hyperuricemia, and lipid metabolism-related genes to alleviate kidney lipid accumulation in STZ-treated rats. Furthermore, quercetin and allopurinol were found to suppress renal NLRP3 inflammasome activation, at least partly, via their anti-hyperuricemic and anti-dyslipidemic effects, resulting in the amelioration of STZ-induced the superimposed nephrotoxicity in rats. These results may provide a basis for the prevention of diabetes-associated nephrotoxicity with urate-lowering agents such as quercetin and allopurinol.
Conflict of interest statement
Competing Interests: The authors have declared that no competing interests exist.
Figures
Figure 1. Quercetin and allopurinol restore streptozotocin (STZ)-induced hyperuricemia and kidney dysfunction in rats.
Biochemical analyses showed uric acid (A-C), creatinine (D-F) and urea nitrogen (G-I) levels in serum and urine, as well as their clearance rates at 7 weeks after STZ injection in different groups of rats as indicated. The data are expressed as the means ± SEM (n = 8). +++ P<0.001 versus normal control; *P<0.05, **P<0.01, ***P<0.001 versus STZ control.
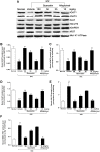
Figure 2. Quercetin and allopurinol regulate renal urate transport-related proteins in streptozotocin (STZ)-treated rats.
Representative Western blot results (A) and graphic presentation showed renal protein expression of rOAT1 (B), rOAT3 (C), rUAT (D), rGLUT9 (E) and rRST (F) at 7 weeks after STZ injection in different groups of rats as indicated. The relative protein levels of rOAT1, rOAT3, rUAT and rGLUT9 were determined after normalization with rGAPDH. The relative BBMV rRST protein levels were normalized to rNa+-K+-ATPase. The data are expressed as the means ± SEM (n = 3–4). ++ P<0.01, +++ P<0.001 versus normal control; *P<0.05, **P<0.01, ***P<0.001 versus STZ control.
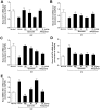
Figure 3. Quercetin and allopurinol regulate renal urate transport-related proteins mRNA in streptozotocin (STZ)-treated rats.
Graphic presentation of renal mRNA levels by real-time PCR analysis of rOAT1 (A), rOAT3 (B), rUAT (C), rGLUT9 (D) and rRST (E) in different groups of rats as indicated. The relative mRNA levels were determined after normalization with rGAPDH. The data are expressed as the means±SEM (n = 3–4). ++ P<0.01, +++ P<0.001 versus normal control; *P<0.05, **P<0.01, ***P<0.001 versus STZ control.
Figure 4. Quercetin and allopurinol reduce lipid levels in streptozotocin (STZ)-treated rats.
Biochemical analyses showed serum and kidney cortex levels of TC (A), TG (B) and NEFA (C) at 7 weeks after STZ injection in different groups of rats as indicated. The data are expressed as the means ± SEM (n = 8). +++ P<0.001 versus normal control; *P<0.05, **P<0.01, ***P<0.001 versus STZ control.
Figure 5. Quercetin and allopurinol reduce renal lipid accumulation in streptozotocin (STZ)-treated rats.
Representative micrographs demonstrated kidney histology in different groups of rats. Kidney sections were stained with oil-red O. Normal control (A), STZ alone (B), STZ plus 100 mg/kg quercetin (C), STZ plus 50 mg/kg quercetin (D), STZ plus 25 mg/kg quercetin (E) and STZ plus 10 mg/kg allopurinol (F). Bar = 50 µm in Fig. 5A.
Figure 6. Quercetin and allopurinol regulate renal mRNA levels of lipid metabolism-related genes in streptozotocin (STZ)-treated rats.
Graphic presentation of renal mRNA levels by real-time PCR analysis of rPPAR-α (A), rCPT1 (B), rACC2 (C) and rOCTN2 (D) at 7 weeks after STZ injection in different groups of rats as indicated. The relative mRNA levels were determined after normalization with rGAPDH. The data are expressed as the means ± SEM (n = 3–4). +++ P<0.001 versus normal control; *P<0.05, **P<0.01, ***P<0.001 versus STZ control.
Figure 7. Quercetin and allopurinol regulate renal expression of lipid metabolism-related genes protein levels in streptozotocin (STZ)-treated rats.
Representative Western blot results (A) and graphic presentation showed renal protein expression of rPPAR-α (B), rCPT1 (C), rACC2 (D), p-rACC2 (E) and rOCTN2 (F) in different groups of rats as indicated. Relative protein levels of rPPAR-α, rCPT1 and rACC2 were determined after normalization with rGAPDH. The relative renal BBMV rOCTN2 protein levels were normalized to rNa+-K+-ATPase. The data are expressed as the means ± SEM (n = 3–4). ++ P<0.01, +++ P<0.001 versus normal control; *P<0.05, **P<0.01, ***P<0.001 versus STZ control.
Figure 8. Quercetin and allopurinol regulate renal L-carnitine levels in streptozotocin (STZ)-treated rats.
Biochemical analyses showed L-carnitine levels in serum (A) and urine (B) and kidney (C) at 7 weeks after STZ injection in different groups of rats as indicated. The data are expressed as the means ± SEM (n = 8). +++ P<0.001 versus normal control; *P<0.05, **P<0.01, ***P<0.001 versus STZ control.
Figure 9. Quercetin and allopurinol attenuate inflammation in streptozotocin (STZ)-treated rats.
HE stain (A) analyses showed inflammatory cell infiltration and PAS-D stain (B) analyses showed kidney structures in different groups of rats. Normal control (a), STZ alone (b), STZ plus 100 mg/kg quercetin (c), STZ plus 50 mg/kg quercetin (d), STZ plus 25 mg/kg quercetin (e) and STZ plus 10 mg/kg allopurinol (f); Bar = 50 µm in Fig. 9Aa and Bar = 15 µm in Fig. 9Ba. Biochemical analyses showed serum and kidney levels of IL-1β (C, E) and IL-18 (D, F) at 7 weeks after STZ injection in different groups of rats as indicated. The data are expressed as the means ± SEM (n = 8). +++ P<0.001 versus normal control; *P<0.05, **P<0.01, ***P<0.001 versus STZ control.
Figure 10. Quercetin and allopurinol inhibit renal NALP3 inflammasome activation in streptozotocin (STZ)-treated rats.
Representative Western blot results (A) and graphic presentation showed renal protein expression of rNALP3 (B), rASC (C) and rCaspase-1 (D) in different groups of rats as indicated. Relative protein levels of rNALP3, rASC and rCaspase-1 were determined after normalization with rGAPDH. For rCaspase-1, the active subunit of P20 was detected. The data are expressed as the means ± SEM (n = 3–4). + P<0.05, +++ P<0.001 versus normal control; *P<0.05, **P<0.01, ***P<0.001 versus STZ control. Graphic presentation of renal mRNA levels by real-time PCR analysis of rNALP3 (E), rASC (F) and rCaspase-1 (G) at 7 weeks after STZ injection in different groups of rats as indicated. The relative mRNA levels were determined after normalization with rGAPDH. The data are expressed as the means ± SEM (n = 3–4). +++ P<0.001 versus normal control; *P<0.05, **P<0.01, ***P<0.001 versus STZ control. Representative Western blot results (H) and graphic presentation showed renal maturation ratio of IL-1β (I) and IL-18 (J) in different groups of rats as indicated. The data are expressed as the means ± SEM (n = 3–4). + P<0.05, ++ P<0.01 versus normal control; *P<0.05, **P<0.01 versus STZ control.
Similar articles
- Allopurinol, quercetin and rutin ameliorate renal NLRP3 inflammasome activation and lipid accumulation in fructose-fed rats.
Hu QH, Zhang X, Pan Y, Li YC, Kong LD. Hu QH, et al. Biochem Pharmacol. 2012 Jul 1;84(1):113-25. doi: 10.1016/j.bcp.2012.03.005. Epub 2012 Mar 16. Biochem Pharmacol. 2012. PMID: 22426011 - Quercetin and allopurinol reduce liver thioredoxin-interacting protein to alleviate inflammation and lipid accumulation in diabetic rats.
Wang W, Wang C, Ding XQ, Pan Y, Gu TT, Wang MX, Liu YL, Wang FM, Wang SJ, Kong LD. Wang W, et al. Br J Pharmacol. 2013 Jul;169(6):1352-71. doi: 10.1111/bph.12226. Br J Pharmacol. 2013. PMID: 23647015 Free PMC article. - Hyperuricemia-induced NLRP3 activation of macrophages contributes to the progression of diabetic nephropathy.
Kim SM, Lee SH, Kim YG, Kim SY, Seo JW, Choi YW, Kim DJ, Jeong KH, Lee TW, Ihm CG, Won KY, Moon JY. Kim SM, et al. Am J Physiol Renal Physiol. 2015 May 1;308(9):F993-F1003. doi: 10.1152/ajprenal.00637.2014. Epub 2015 Jan 28. Am J Physiol Renal Physiol. 2015. PMID: 25651569 - The roles of NLRP3 inflammasome-mediated signaling pathways in hyperuricemic nephropathy.
Wen L, Yang H, Ma L, Fu P. Wen L, et al. Mol Cell Biochem. 2021 Mar;476(3):1377-1386. doi: 10.1007/s11010-020-03997-z. Epub 2021 Jan 3. Mol Cell Biochem. 2021. PMID: 33389490 Review. - Roles of the NLRP3 inflammasome in the pathogenesis of diabetic nephropathy.
Qiu YY, Tang LQ. Qiu YY, et al. Pharmacol Res. 2016 Dec;114:251-264. doi: 10.1016/j.phrs.2016.11.004. Epub 2016 Nov 5. Pharmacol Res. 2016. PMID: 27826011 Review.
Cited by
- The role of quercetin in NLRP3-associated inflammation.
Wu J, Lv T, Liu Y, Liu Y, Han Y, Liu X, Peng X, Tang F, Cai J. Wu J, et al. Inflammopharmacology. 2024 Dec;32(6):3585-3610. doi: 10.1007/s10787-024-01566-0. Epub 2024 Sep 22. Inflammopharmacology. 2024. PMID: 39306817 Review. - Potential Role of Dietary Phenolic Compounds in the Prevention and Treatment of Rheumatoid Arthritis: Current Reports.
Gonçalves AC, Rodrigues S, Fonseca R, Silva LR. Gonçalves AC, et al. Pharmaceuticals (Basel). 2024 May 6;17(5):590. doi: 10.3390/ph17050590. Pharmaceuticals (Basel). 2024. PMID: 38794160 Free PMC article. Review. - Higher Dietary Polyphenol Intake Is Associated With Lower Blood Inflammatory Markers.
Dryer-Beers ER, Griffin J, Matthews PM, Frost GS. Dryer-Beers ER, et al. J Nutr. 2024 Aug;154(8):2470-2480. doi: 10.1016/j.tjnut.2024.05.005. Epub 2024 May 11. J Nutr. 2024. PMID: 38740187 - Lipotoxicity and immunometabolism in ischemic acute kidney injury: current perspectives and future directions.
Otunla AA, Shanmugarajah K, Davies AH, Shalhoub J. Otunla AA, et al. Front Pharmacol. 2024 Feb 23;15:1355674. doi: 10.3389/fphar.2024.1355674. eCollection 2024. Front Pharmacol. 2024. PMID: 38464721 Free PMC article. Review. - Insights into the Therapeutic uses of Plant Derive Phytocompounds onDiabetic Nephropathy.
Mitra P, Jana S, Roy S. Mitra P, et al. Curr Diabetes Rev. 2024;20(9):e230124225973. doi: 10.2174/0115733998273395231117114600. Curr Diabetes Rev. 2024. PMID: 38265383 Review.
References
- Donath MY, Shoelson SE. Type 2 diabetes as an inflammatory disease. Nat Rev Immunol. 2011;11:98–107. - PubMed
- Murea M, Freedman BI, Parks JS, Antinozzi PA, Elbein SC, et al. Lipotoxicity in diabetic nephropathy: the potential role of fatty acid oxidation. Clin J Am Soc Nephrol. 2010;5:2373–2379. - PubMed
- Hovind P, Rossing P, Johnson RJ, Parving HH. Serum uric acid as a new player in the development of diabetic nephropathy. J Ren Nutr. 2011;21:124–127. - PubMed
Publication types
MeSH terms
Substances
LinkOut - more resources
Full Text Sources
Medical
Miscellaneous


