Functional importance of Dicer protein in the adaptive cellular response to hypoxia - PubMed (original) (raw)
. 2012 Aug 17;287(34):29003-20.
doi: 10.1074/jbc.M112.373365. Epub 2012 Jun 28.
Julie L Metcalf, Matthew S Yan, Paul J Turgeon, Jenny Jing Wang, Maria Chalsev, Tania N Petruzziello-Pellegrini, Albert K Y Tsui, Jeff Z He, Helena Dhamko, H S Jeffrey Man, G Brett Robb, Bin T Teh, Michael Ohh, Philip A Marsden
Affiliations
- PMID: 22745131
- PMCID: PMC3436557
- DOI: 10.1074/jbc.M112.373365
Functional importance of Dicer protein in the adaptive cellular response to hypoxia
J J David Ho et al. J Biol Chem. 2012.
Abstract
The processes by which cells sense and respond to ambient oxygen concentration are fundamental to cell survival and function, and they commonly target gene regulatory events. To date, however, little is known about the link between the microRNA pathway and hypoxia signaling. Here, we show in vitro and in vivo that chronic hypoxia impairs Dicer (DICER1) expression and activity, resulting in global consequences on microRNA biogenesis. We show that von Hippel-Lindau-dependent down-regulation of Dicer is key to the expression and function of hypoxia-inducible factor α (HIF-α) subunits. Specifically, we show that EPAS1/HIF-2α is regulated by the Dicer-dependent microRNA miR-185, which is down-regulated by hypoxia. Full expression of hypoxia-responsive/HIF target genes in chronic hypoxia (e.g. VEGFA, FLT1/VEGFR1, KDR/VEGFR2, BNIP3L, and SLC2A1/GLUT1), the function of which is to regulate various adaptive responses to compromised oxygen availability, is also dependent on hypoxia-mediated down-regulation of Dicer function and changes in post-transcriptional gene regulation. Therefore, functional deficiency of Dicer in chronic hypoxia is relevant to both HIF-α isoforms and hypoxia-responsive/HIF target genes, especially in the vascular endothelium. These findings have relevance to emerging therapies given that we show that the efficacy of RNA interference under chronic hypoxia, but not normal oxygen availability, is Dicer-dependent. Collectively, these findings show that the down-regulation of Dicer under chronic hypoxia is an adaptive mechanism that serves to maintain the cellular hypoxic response through HIF-α- and microRNA-dependent mechanisms, thereby providing an essential mechanistic insight into the oxygen-dependent microRNA regulatory pathway.
Figures
FIGURE 1.
Global effect of chronic hypoxia on microRNA expression in endothelial cells. A, volcano plot of 360 detectable microRNAs in 24-h hypoxic versus control HUVEC as measured by microarray profiling (n = 3). Expression levels of representative down-regulated microRNAs (B) and corresponding precursor microRNAs (pri/pre-microRNAs) (C) and the ratio of precursor microRNAs to their mature counterparts in normoxic versus 24-h hypoxic HUVEC (D) are shown. Data represent mean ± S.E. (error bars) (n = 3). * and † denote p < 0.05 compared with normoxia and 4-h hypoxia, respectively.
FIGURE 2.
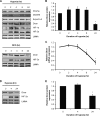
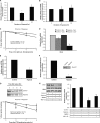
Effect of chronic hypoxia on Dicer expression. A, representative immunoblots of hypoxic (upper panel) and desferrioxamine (DFO)-treated (lower panel) HUVEC. B, quantification of Dicer immunoblots in A. Data represent mean ± S.E. (error bars) (n = 3). C, Dicer mRNA levels in hypoxic HUVEC. Data represent mean ± S.E. (error bars) (n = 4). D, representative immunoblots of hypoxic human dermal microvascular endothelial cells. E, quantification of Dicer immunoblots in D. Data represent mean ± S.E. (error bars) (n = 3). * denotes p < 0.05 compared with 0 h.
FIGURE 3.
Dicer-dependent down-regulation of HIF-α isoforms and hypoxia-responsive genes in chronic hypoxia. A, representative immunoblots of control versus 24-h hypoxic Dicer-overexpressing and control vector-transfected HUVEC. * denotes a nonspecific band. B, quantifications of HIF-1α, HIF-2α, GLUT1, BNIP3L, VEGFR1, and VEGFR2 immunoblots in A. Data represent mean ± S.E. (error bars) (n = 3). * denotes p < 0.05 compared with hypoxia-empty vector. C, relative global protein synthesis, i.e. [3H]leucine incorporation, in control versus 24-h hypoxic Dicer-overexpressing and control vector-transfected HUVEC. A representative experiment is shown. Data represent mean ± S.E. (error bars) of duplicate measurements. * and † denote p < 0.05 compared with control-Empty vector and hypoxia-empty vector, respectively. D, mRNA levels of HIF-2α, GLUT1, BNIP3L, total VEGFR1, soluble VEGFR1 (sVEGFR1), VEGFR2, HIF-1α, and CXCR4 in control versus 24-h hypoxic Dicer-overexpressing and control vector-transfected HUVEC. Data represent mean ± S.E. (error bars) (n = 3). * and † denote p < 0.05 compared with control-empty vector and hypoxia-empty vector, respectively.
FIGURE 4.
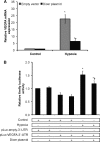
Dicer-dependent, HIF-independent down-regulation of VEGFA in chronic hypoxia. A, VEGFA mRNA levels in control versus 24-h hypoxic Dicer-overexpressing and control vector-transfected HUVEC. Data represent mean ± S.E. (error bars) (n = 3). * and † denote p < 0.05 compared with control-empty vector and hypoxia-empty vector, respectively. B, relative firefly luciferase activity. Data represent mean ± S.E. (error bars) (n = 3). * and † denote p < 0.05 compared with control and hypoxic non-over-expressing HUVEC, respectively, with pLuc-VEGFA-3′-UTR.
FIGURE 5.
Loss of HIF-2α regulation by the Dicer-dependent miR-185 in chronic hypoxia. A, relative firefly luciferase activity. Data represent mean ± S.E. (error bars) (n = 3). * and † denote p < 0.05 compared with control and 24-h hypoxic non-over-expressing HUVEC, respectively, with pLuc-HIF2A-3′-UTR. B, miR-185 binding sites in HIF-2α 3′-UTR predicted by TargetScan and miRanda algorithms. Levels of miR-185 (C) and precursor miR-185 (D) in control versus 24-h hypoxic Dicer-overexpressing and control vector-transfected HUVEC are shown. Data represent mean ± S.E. (error bars) (n = 3). * and † denote p < 0.05 compared with control-empty vector and hypoxia-empty vector, respectively. E, representative immunoblots of control versus 24-h hypoxic HUVEC transfected with microRNA mimics. F, quantification of HIF-2α immunoblots in E. Data represent mean ± S.E. (error bars) (n = 3). * denotes p < 0.05 compared with control-negative control (Neg Ctrl) mimic. G, schematic of chimeric luciferase-HIF-2α 3′-UTR reporter construct with the indicated binding sites for the top five hypoxia-regulated microRNAs predicted to target HIF-2α. nt, nucleotides; Luc, luciferase. H, relative firefly luciferase activity. Data represent mean ± S.E. (error bars) (n = 3). *, †, ‡, and § denote p < 0.05 compared with the corresponding control-control (Ctrl), hypoxia-control, hypoxia-control-WT 3′-UTR, and hypoxia-miR-185, respectively. ¶ denotes p < 0.05 compared with control-control of WT 3′-UTR. Wt 3′-UTR, wild-type HIF-2α 3′-UTR; miR-185 mut, wild-type HIF-2α 3′-UTR with mutations in both miR-185 binding sites; 6-site mut, wild-type HIF-2α 3′-UTR with mutations in binding sites of all five microRNAs.
FIGURE 6.
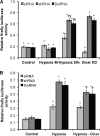
Effect of chronic hypoxia on Dicer-dependent versus Dicer-independent RNA interference. A, relative firefly luciferase activity. * and † denote p < 0.05 compared with corresponding non-silencing control and control, respectively. § denotes p < 0.05 compared with 24-h hypoxia-siRNA. Dicer KD, Dicer knockdown in control HUVEC. B, relative firefly luciferase activity. * and † denote p < 0.05 compared with corresponding control and hypoxia, respectively. Data represent mean ± S.E. (error bars) (n = 3).
FIGURE 7.
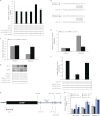
Effect of chronic hypoxia on Dicer mRNA and protein. A, relative RNA polymerase II (Pol II) occupancy at the Dicer proximal promoter in hypoxic HUVEC. Data represent mean ± S.E. (error bars) (n = 3). * denotes p < 0.05 compared with 0 h. B, Dicer pre-mRNA measurements in hypoxic HUVEC. Data represent mean ± S.E. (error bars) (n = 4). C, Dicer mRNA half-life measurements in control versus hypoxic HUVEC. Data represent mean ± S.E. (error bars) (n = 3). D, Dicer mRNA levels in nuclear (Nuc) versus cytoplasmic (Cyto) fractions of control versus 24-h hypoxic HUVEC. Data represent mean ± S.E. (error bars) (n = 3). * and † denote statistical significance (p < 0.05) compared with hypoxia-nuclear and control-cytoplasmic, respectively. Relative rate of global protein synthesis (E) and relative Dicer protein synthesis (F) in normoxic versus 24-h hypoxic HUVEC measured using [35S]methionine incorporation. A representative gel is shown for F. Data represent mean ± S.E. (error bars) (n = 3). * denotes p < 0.05 compared with normoxia. G, Dicer protein half-life measurements in control versus hypoxic HUVEC. Data represent mean ± S.E. (error bars) (n = 3). A representative gel from each condition is shown. H, representative immunoblots of control versus 24-h hypoxic HUVEC treated with MG-132 (left panel). Quantification of Dicer immunoblots is shown in the right panel. Data represent mean ± S.E. (error bars) (n = 3). * and † denote statistical significance (p < 0.05) compared with control-DMSO and hypoxia-DMSO, respectively. IP, immunoprecipitation.
FIGURE 8.
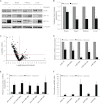
Effect of chronic hypoxia on Dicer expression and function in mouse organs. A, representative immunoblots of control versus 24-h hypoxic mouse brain, heart, kidney, and liver. B, quantification of Dicer immunoblots in A. Data represent mean ± S.E. (error bars) (n = 5/6). * denotes p < 0.05 compared with normoxia. C, volcano plot of 582 detectable microRNAs in 24-h hypoxic versus control mouse kidney as measured by qRT-PCR profiling (n = 4). Expression levels of representative down-regulated microRNAs (D) and corresponding precursor microRNAs (E) and the ratio of precursor microRNAs to their mature counterparts (F) are shown. Data represent mean ± S.E. (error bars) (n = 4). * denotes statistical significance (p < 0.05) compared with kidney-control.
FIGURE 9.
Down-regulation of Dicer in chronic hypoxia is VHL-dependent. A, representative immunoblots of VHL-deficient RCC4, 786-O, and UMRC2 cells reconstituted with wild-type or mutant VHL. B, quantification of Dicer immunoblots in RCC4, 786-O, and UMRC2. Data represent mean ± S.E. (error bars) (n = 3). * denotes p < 0.05 compared with the corresponding wild-type VHL-reconstituted condition. C, Dicer mRNA levels in RCC4-VHL and RCC4-Mock cells. Data represent mean ± S.E. (error bars) (n = 3). * denotes p < 0.05 compared with RCC4-VHL. Representative immunoblots (D) and Dicer mRNA levels (E) in control versus 24-h hypoxic RCC4-VHL and RCC4-Mock cells are shown. Data represent mean ± S.E. (error bars) (n = 3). * denotes p < 0.05 compared with corresponding control. F, microarray analysis of Dicer mRNA levels in CCRCC tumors (n = 105) versus non-diseased renal cortex controls (n = 12, p = 0.02).
FIGURE 10.
Down-regulation of Dicer mRNA in chronic hypoxia is not HIF-dependent. Representative immunoblots (A) and mRNA levels (B) of Dicer mRNA, Dicer pre-mRNA, GLUT1, and VEGFA in 786-O clones that have been stably transfected with either a HIF-2α-targeting shRNA or a scrambled shRNA are shown. Data represent mean ± S.E. (error bars) (n = 5). * denotes statistical significance (p < 0.05) compared with scrambled shRNA.
Similar articles
- Dicer suppresses the malignant phenotype in VHL-deficient clear cell renal cell carcinoma by inhibiting HIF-2α.
Fan Y, Li H, Ma X, Gao Y, Bao X, Du Q, Ma M, Liu K, Yao Y, Huang Q, Zhang Y, Zhang X. Fan Y, et al. Oncotarget. 2016 Apr 5;7(14):18280-94. doi: 10.18632/oncotarget.7807. Oncotarget. 2016. PMID: 26943772 Free PMC article. - Regulation of HIF by the von Hippel-Lindau tumour suppressor: implications for cellular oxygen sensing.
Mole DR, Maxwell PH, Pugh CW, Ratcliffe PJ. Mole DR, et al. IUBMB Life. 2001 Jul;52(1-2):43-7. doi: 10.1080/15216540252774757. IUBMB Life. 2001. PMID: 11795592 Review. - Hypoxia: a master regulator of microRNA biogenesis and activity.
Nallamshetty S, Chan SY, Loscalzo J. Nallamshetty S, et al. Free Radic Biol Med. 2013 Sep;64:20-30. doi: 10.1016/j.freeradbiomed.2013.05.022. Epub 2013 May 24. Free Radic Biol Med. 2013. PMID: 23712003 Free PMC article. Review.
Cited by
- Does proteasome regulate the level of microRNA-1 in cardiomyocytes? Application to anoxia-reoxygenation.
Gurianova V, Stroy D, Kruzliak P, Kyrichenko V, Moibenko A, Dosenko V. Gurianova V, et al. Mol Cell Biochem. 2015 Jun;404(1-2):45-51. doi: 10.1007/s11010-015-2365-7. Epub 2015 Feb 28. Mol Cell Biochem. 2015. PMID: 25724682 - Dicer suppresses MMP-2-mediated invasion and VEGFA-induced angiogenesis and serves as a promising prognostic biomarker in human clear cell renal cell carcinoma.
Chen YS, Meng F, Li HL, Liu QH, Hou PF, Bai J, Zheng JN. Chen YS, et al. Oncotarget. 2016 Dec 20;7(51):84299-84313. doi: 10.18632/oncotarget.12520. Oncotarget. 2016. PMID: 27732931 Free PMC article. - Low DICER1 expression is associated with attenuated neutrophil differentiation and autophagy of NB4 APL cells.
Wampfler J, Federzoni EA, Torbett BE, Fey MF, Tschan MP. Wampfler J, et al. J Leukoc Biol. 2015 Sep;98(3):357-63. doi: 10.1189/jlb.1AB0514-258R. Epub 2015 May 19. J Leukoc Biol. 2015. PMID: 25990244 Free PMC article. - The miR-183/ItgA3 axis is a key regulator of prosensory area during early inner ear development.
Van den Ackerveken P, Mounier A, Huyghe A, Sacheli R, Vanlerberghe PB, Volvert ML, Delacroix L, Nguyen L, Malgrange B. Van den Ackerveken P, et al. Cell Death Differ. 2017 Dec;24(12):2054-2065. doi: 10.1038/cdd.2017.127. Epub 2017 Aug 4. Cell Death Differ. 2017. PMID: 28777373 Free PMC article. - HIF-1α promotes autophagic proteolysis of Dicer and enhances tumor metastasis.
Lai HH, Li JN, Wang MY, Huang HY, Croce CM, Sun HL, Lyu YJ, Kang JW, Chiu CF, Hung MC, Suzuki HI, Chen PS. Lai HH, et al. J Clin Invest. 2018 Feb 1;128(2):625-643. doi: 10.1172/JCI89212. Epub 2017 Dec 18. J Clin Invest. 2018. PMID: 29251629 Free PMC article.
References
- Semenza G. L. (2011) Oxygen sensing, homeostasis, and disease. N. Engl. J. Med. 365, 537–547 - PubMed
- Ho J. J., Man H. S., Marsden P. A. (2012) Nitric oxide signaling in hypoxia. J. Mol. Med. 90, 217–231 - PubMed
- McQuillan L. P., Leung G. K., Marsden P. A., Kostyk S. K., Kourembanas S. (1994) Hypoxia inhibits expression of eNOS via transcriptional and posttranscriptional mechanisms. Am. J. Physiol. Heart Circ. Physiol. 267, H1921–H1927 - PubMed
Publication types
MeSH terms
Substances
LinkOut - more resources
Full Text Sources
Miscellaneous

