Endothelial Wnt/β-catenin signaling inhibits glioma angiogenesis and normalizes tumor blood vessels by inducing PDGF-B expression - PubMed (original) (raw)
. 2012 Aug 27;209(9):1611-27.
doi: 10.1084/jem.20111580. Epub 2012 Aug 20.
Cathrin J Czupalla, Nicole Ziegler, Kavi Devraj, Jenny Zinke, Sascha Seidel, Rosario Heck, Sonja Thom, Jadranka Macas, Ernesto Bockamp, Marcus Fruttiger, Makoto M Taketo, Stefanie Dimmeler, Karl H Plate, Stefan Liebner
Affiliations
- PMID: 22908324
- PMCID: PMC3428944
- DOI: 10.1084/jem.20111580
Endothelial Wnt/β-catenin signaling inhibits glioma angiogenesis and normalizes tumor blood vessels by inducing PDGF-B expression
Marco Reis et al. J Exp Med. 2012.
Abstract
Endothelial Wnt/β-catenin signaling is necessary for angiogenesis of the central nervous system and blood-brain barrier (BBB) differentiation, but its relevance for glioma vascularization is unknown. In this study, we show that doxycycline-dependent Wnt1 expression in subcutaneous and intracranial mouse glioma models induced endothelial Wnt/β-catenin signaling and led to diminished tumor growth, reduced vascular density, and normalized vessels with increased mural cell attachment. These findings were corroborated in GL261 glioma cells intracranially transplanted in mice expressing dominant-active β-catenin specifically in the endothelium. Enforced endothelial β-catenin signaling restored BBB characteristics, whereas inhibition by Dkk1 (Dickkopf-1) had opposing effects. By overactivating the Wnt pathway, we induced the Wnt/β-catenin-Dll4/Notch signaling cascade in tumor endothelia, blocking an angiogenic and favoring a quiescent vascular phenotype, indicated by induction of stalk cell genes. We show that β-catenin transcriptional activity directly regulated endothelial expression of platelet-derived growth factor B (PDGF-B), leading to mural cell recruitment thereby contributing to vascular quiescence and barrier function. We propose that reinforced Wnt/β-catenin signaling leads to inhibition of angiogenesis with normalized and less permeable vessels, which might prove to be a valuable therapeutic target for antiangiogenic and edema glioma therapy.
Figures
Figure 1.
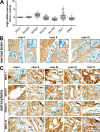
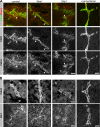
Nuclear β-catenin in vessels of human astrocytoma does not correlate with WHO grade. (A) TCGA database analyses for Wnt1, Wnt3a, Wnt5a, Wnt7a, Wnt7b, Dkk1, and Dkk2 mRNA expression as log2-fold expression. Differences in mRNA expression in GBM compared with normal central nervous system tissue (dashed red line) are shown. (B and C) Paraffin sections of three normal human brains (B) and five different human astrocytoma WHO grades I–IV (C) stained for β-catenin and analyzed for its endothelial, nuclear localization. Insets show individual nuclei in higher magnification. Bars: (B) 14 µm; (C) 20 µm.
Figure 2.
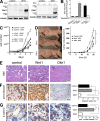
Wnt1 expression decreased subcutaneous GL261 tumor growth and increased animal survival. (A) Western blots showing Wnt1 and Dkk1 expression +/−DOX in GL261 cells. (B) sTOP-FLASH assay on human embryonic kidney (HEK293)/GL261 co-cultures without DOX. Monoculture of transfected HEK293 cells served as baseline. Wnt1 and Dkk1 cells were cultured without (−) or with (+) Wnt3aCM (one experiment in triplicate). (C) In vitro proliferation of the control-, Wnt1-, and Dkk1-GL261 line cultured +/−DOX. (D, left) Representative pictures of NUDE mice with subcutaneous tumors −DOX. (right) Tumor volumes (n = 7/group) of the transplanted glioma cell lines −DOX (*, P < 0.05; **, P < 0.01). (E) H&E-stained paraffin sections revealed reduced necrotic areas for Dkk1-expressing tumors (N). (F, left) Pimonidazole (brown) immunohistochemistry staining revealed tumor hypoxia, hematoxylin counterstaining (blue). (right) Hypoxia in Dkk1−D compared with the control−D (*, P < 0.05) and Wnt1−D tumors (**, P < 0.01; n = 4 tumors/group, slices from the center of similar sized tumors). (G, left) Representative vessels, stained for nuclear β-catenin (brown) and hematoxylin (blue) of control−D, Wnt1−D, and Dkk1−D tumors. Arrowheads point to β-catenin+ nuclei. (right) Quantification of β-catenin+ nuclei (n = 4 tumors/group, 20 vessels/tumor; ***, P < 0.001). Bars: (D) 1 cm; (E and F) 400 µm; (G) 35 µm. Error bars indicate SEM.
Figure 3.
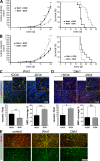
Tumor-derived Wnt1 reduced and normalized subcutaneous tumor vascularization, whereas Dkk1 caused the opposite effect. (A) Tumor growth in Wnt1−D compared with Wnt1+D condition (left; n = 12/group; **, P < 0.01; ***, P < 0.001) and mouse survival (right; n = 12/group). (B) Tumor volume for Dkk1−D compared with Dkk1+D condition (left; n = 12/group; *, P < 0.05; **, P < 0.01; ***, P < 0.001) and mouse survival of Dkk1+/−D tumors (right; n = 12/group). (C, top) IF staining on subcutaneous Wnt1 tumors for CD31/PECAM-1, α-SMA, and TOPRO-3. (bottom left) Vessel density of subcutaneous Wnt1 tumors +/−DOX (n = 5 tumors/group, 10 pictures/tumor; **, P < 0.01). (bottom right) Association of α-SMA+ cells to ECs in Wnt1+/−D tumors (n = 5 tumors/group, 10 vessels/tumor; ***, P < 0.001). (D) Same staining and experimental settings as in C for subcutaneous Dkk1+/−D tumors (*, P < 0.05). (C and D) Insets show vessels in higher magnification. (E) Perfusion with isolectin revealed that vessels from control−D, Wnt1−D, and Dkk1−D tumors exhibited blood flow. Bars: (C and D) 400 µm; (E) 200 µm. Error bars indicate SEM.
Figure 4.
Tumor cell–free Matrigel plug assay confirmed the antiangiogenic effect observed in Wnt1-GL261 tumors. (A) Immunohistochemistry staining for CD31/PECAM-1 (red) and hematoxylin counterstaining (blue) of Matrigel plug sections, supplemented with diluent (control), 400 µg/ml human Wnt1, or 200 µg/ml mouse Dkk1 recombinant proteins. Bar, 200 µm. (B) Quantification of CD31+ area in percentage in Matrigel plugs (n = 6 plugs/group, 8 representative pictures/plug; **, P < 0.001). Error bars indicate SEM.
Figure 5.
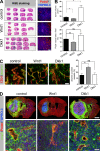
Tumor-derived Wnt1 normalized vascularization and retained vascular barrier properties in GL261 glioma. (A, left) Representative H&E staining of serial thick sections of tumor-bearing mouse brains. (right) Corresponding IF staining for Podxl and TOPRO-3. (B, top) Quantification of glioma volume based on H&E staining (control−D n = 3, Wnt1−D n = 6, and Dkk1−D n = 4; *, P < 0.05). (bottom) Podxl+ vessel areas within tumors (control n = 4, Wnt1 n = 6, Dkk1 n = 5; **, P < 0.01). (C) IF staining for CD31/PECAM-1 and desmin (n = 3 tumors/group, 8 pictures/tumor; *, P < 0.05). (D) Large image reconstructions of IF staining for mouse endogenous IgG (mIgG), Podxl, and TOPRO-3 on brain sections bearing control−D, Wnt1−D, and Dkk1−D glioma. Bars: (A) 200 µm; (C) 50 µm; (D, top) 1 mm; (D, bottom) 27 µm. Error bars indicate SEM.
Figure 6.
Cldn3, Cldn5, and ZO-1 showed junctional localization in vessels of Wnt1-expressing GL261 gliomas. (A) IF staining for CD31/PECAM and Cldn3 on GL261 glioma and normal brain sections. Arrowheads indicate junctional localization. (B) IF staining for Cldn5 and ZO-1 on cryosections of GL261 brain tumors and normal brain. Bars: (A and B, tunors) 33 µm; (A and B, normal brain) 10 µm.
Figure 7.
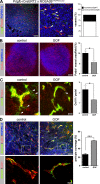
Vascular effects observed in Wnt1-expressing gliomas are EC autonomous. (A, left) IF staining for β-galactosidase (β-gal), Podxl, and TOPRO-3 on GL261 glioma sections from Pdgfb-iCreERT2 × ROSA26STOPfloxLacZ mice treated with tamoxifen. (right) Quantification of β-gal+ vessels. (B, left) IF staining for Podxl and TOPRO-3 on GL261 glioma sections from Pdgfb-iCreERT2 (control) and Pdgfb-iCreERT2 × βCatEx3flox (GOF) mice. (right) Quantification of Podxl+ areas within tumors (n = 4 tumors/group, 10 pictures/tumor; *, P < 0.05). (C, left) ColIV and Podxl staining of tumor sections from control and GOF mice. Arrowheads point to nonendothelial-associated ColIV+ structures. (right) ColIV/Podxl ratio (n = 4 tumors/group, 8 pictures/tumor; *, P < 0.05). (D, top left) IF staining for CD31/PECAM-1 and desmin on tumor sections from control and GOF mice (n = 4 tumors/group, 10 pictures/tumor). (right) Quantification of PC coverage (***, P < 0.001). (bottom left) Representative vessel in higher magnification (white boxes). Bars: (A [left] and D [top]) 160 µm; (A, right) 40 µm; (B) 400 µm; (C and D [bottom]) 20 µm. Error bars indicate SEM.
Figure 8.
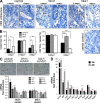
Glioma-derived Wnt1 up-regulated endothelial Dll4, leading to a stalk cell–like gene signature. (A) ISH against Dll4 (black) and hematoxylin (blue) of subcutaneous control−D, Wnt1−D, and Dkk1−D GL261 tumors, showing representative small (0–300 µm2; left) and large (>300 µm2; right) vessels. (B, left) Quantification of vessel diameter (n = 3 tumors/group, 15 pictures/tumor) grouped in categories of 0–30 µm2, 31–300 µm2, and >300 µm2 (*, P < 0.05; **, P < 0.01). (right) Quantification of Dll4+ ECs (n = 6 tumors/group, 5 small and 5 large vessels/tumor; ***, P < 0.001). (C, top) HUVECs co-cultivated with control−D, Wnt1−D, and Dkk1−D GL261 cells (asterisks indicate HUVECs). (bottom) qRT-PCR (n = 6) for human genes regulated by Wnt1−D and Dkk1−D compared with control−D co-cultures (red line). (D) qRT-PCR for mouse genes regulated in MBEs stimulated by Wnt3aCM for 18 and 48 h compared with controlCM (red line; n = 3; *, P < 0.05; **, P < 0.01; ***, P < 0.001). Bars: (A) 50 µm; (C) 80 µm. Error bars indicate SEM.
Figure 9.
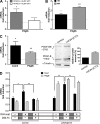
Pdgfb is a Notch-independent target of β-catenin signaling in ECs. (A) HUVECs co-cultivated with control−D, Wnt1−D, and Dkk1−D GL261 cells. qRT-PCR (n = 4) for human PDGFB regulated by Wnt1−D or Dkk1−D (ns) compared with control−D (gray line; *, P < 0.05). (B) qRT-PCR for Pdgfb gene regulated in MBEs stimulated by Wnt3aCM for 18 and 48 h compared with controlCM (gray line; n = 4; *, P < 0.05; ***, P < 0.001). (C, left) qRT-PCR for Axin2 and Pdgfb regulated in β-catenin–deficient ECs transduced with LefΔN-βCTA compared with the vector control (gray line; n = 4; *, P < 0.05; **, P < 0.01). (right) Representative Western blot (n = 1) for PDGF-B from LefΔN-βCTA ECs compared with the vector control; top band shows the nonreduced (PDGF-BB) and bottom band reduced protein (PDGF-B). Densitometric analysis shows the summarized values for both forms of PDGF-B of samples loaded twice. (D) qRT-PCR of β-catenin–deficient ECs (control) or transduced with LefΔN-βCTA grown for 24 h either on gelatin- or Dll4-coated dishes (n = 3). Notch pathway induction was monitored by Hes1 expression (*, P < 0.05; **, P < 0.01). Notch signaling was blocked by Dll4-Fc. Error bars indicate SEM.
Figure 10.
PDGF-B is up-regulated in the tumor endothelium upon Wnt1 expression. (A) Representative ISH for Pdgfb of subcutaneous Wnt1+/−D tumors. Asterisks indicate vessels, and arrowheads point to Pdgfb+ ECs. Insets show representative vessels in higher magnification. Bars: (full images) 50 µm; (insets) 18 µm. (B, left) Representative picture of isolated subcutaneous tumor vessels and dot blot for von Willebrand factor (vWF). (right) Representative Western blot for PDGF-B with pooled subcutaneous tumors vessels (n = 2 tumors/group). Densitometric analysis for PDGF-B of five independent Western blot experiments. Error bars indicate SEM.
Similar articles
- β-Catenin Is Required for Endothelial Cyp1b1 Regulation Influencing Metabolic Barrier Function.
Ziegler N, Awwad K, Fisslthaler B, Reis M, Devraj K, Corada M, Minardi SP, Dejana E, Plate KH, Fleming I, Liebner S. Ziegler N, et al. J Neurosci. 2016 Aug 24;36(34):8921-35. doi: 10.1523/JNEUROSCI.0148-16.2016. J Neurosci. 2016. PMID: 27559173 Free PMC article. - The Wnt/beta-catenin pathway modulates vascular remodeling and specification by upregulating Dll4/Notch signaling.
Corada M, Nyqvist D, Orsenigo F, Caprini A, Giampietro C, Taketo MM, Iruela-Arispe ML, Adams RH, Dejana E. Corada M, et al. Dev Cell. 2010 Jun 15;18(6):938-49. doi: 10.1016/j.devcel.2010.05.006. Dev Cell. 2010. PMID: 20627076 Free PMC article. - ZNF326 promotes malignant phenotype of glioma by up-regulating HDAC7 expression and activating Wnt pathway.
Yu X, Wang M, Wu J, Han Q, Zhang X. Yu X, et al. J Exp Clin Cancer Res. 2019 Jan 28;38(1):40. doi: 10.1186/s13046-019-1031-4. J Exp Clin Cancer Res. 2019. PMID: 30691485 Free PMC article. - FoxM1 and Wnt/β-catenin signaling in glioma stem cells.
Gong A, Huang S. Gong A, et al. Cancer Res. 2012 Nov 15;72(22):5658-62. doi: 10.1158/0008-5472.CAN-12-0953. Epub 2012 Nov 8. Cancer Res. 2012. PMID: 23139209 Free PMC article. Review. - Vasculogenesis and angiogenesis initiation under normoxic conditions through Wnt/β-catenin pathway in gliomas.
Vallée A, Guillevin R, Vallée JN. Vallée A, et al. Rev Neurosci. 2018 Jan 26;29(1):71-91. doi: 10.1515/revneuro-2017-0032. Rev Neurosci. 2018. PMID: 28822229 Review.
Cited by
- β-Catenin-Gli1 interaction regulates proliferation and tumor growth in medulloblastoma.
Zinke J, Schneider FT, Harter PN, Thom S, Ziegler N, Toftgård R, Plate KH, Liebner S. Zinke J, et al. Mol Cancer. 2015 Feb 3;14(1):17. doi: 10.1186/s12943-015-0294-4. Mol Cancer. 2015. PMID: 25645196 Free PMC article. - Accelerated Bone Regeneration by Astragaloside IV through Stimulating the Coupling of Osteogenesis and Angiogenesis.
Wang F, Qian H, Kong L, Wang W, Wang X, Xu Z, Chai Y, Xu J, Kang Q. Wang F, et al. Int J Biol Sci. 2021 Apr 24;17(7):1821-1836. doi: 10.7150/ijbs.57681. eCollection 2021. Int J Biol Sci. 2021. PMID: 33994865 Free PMC article. - Compromised endothelial Wnt/β-catenin signaling mediates the blood-brain barrier disruption and leads to neuroinflammation in endotoxemia.
Huang X, Wei P, Fang C, Yu M, Yang S, Qiu L, Wang Y, Xu A, Hoo RLC, Chang J. Huang X, et al. J Neuroinflammation. 2024 Oct 19;21(1):265. doi: 10.1186/s12974-024-03261-x. J Neuroinflammation. 2024. PMID: 39427196 Free PMC article. - Expression profiles and prognostic significance of WNT family members in glioma via bioinformatic analysis.
Xu A, Yang H, Gao K, Zhan Z, Song Z, Huang T, Song Y. Xu A, et al. Biosci Rep. 2020 Mar 27;40(3):BSR20194255. doi: 10.1042/BSR20194255. Biosci Rep. 2020. PMID: 32181818 Free PMC article.
References
- Aicher A., Kollet O., Heeschen C., Liebner S., Urbich C., Ihling C., Orlandi A., Lapidot T., Zeiher A.M., Dimmeler S. 2008. The Wnt antagonist Dickkopf-1 mobilizes vasculogenic progenitor cells via activation of the bone marrow endosteal stem cell niche. Circ. Res. 103:796–803 10.1161/CIRCRESAHA.107.172718 - DOI - PubMed
