Inhibition of CXCR2 profoundly suppresses inflammation-driven and spontaneous tumorigenesis - PubMed (original) (raw)
. 2012 Sep;122(9):3127-44.
doi: 10.1172/JCI61067. Epub 2012 Aug 27.
Affiliations
- PMID: 22922255
- PMCID: PMC3428079
- DOI: 10.1172/JCI61067
Inhibition of CXCR2 profoundly suppresses inflammation-driven and spontaneous tumorigenesis
Thomas Jamieson et al. J Clin Invest. 2012 Sep.
Abstract
The chemokine receptor CXCR2 is a key mediator of neutrophil migration that also plays a role in tumor development. However, CXCR2 influences tumors through multiple mechanisms and might promote or inhibit tumor development depending on context. Here, we used several mouse models of spontaneous and inflammation-driven neoplasia to define indispensable roles for CXCR2 in benign and malignant tumors. CXCR2-activating chemokines were part of the secretome of cultured primary benign intestinal adenomas (ApcMin/+) and highly expressed by all tumors in all models. CXCR2 deficiency profoundly suppressed inflammation-driven tumorigenesis in skin and intestine as well as spontaneous adenocarcinoma formation in a model of invasive intestinal adenocarcinoma (AhCreER;Apcfl/+;Ptenfl/fl mice). Pepducin-mediated CXCR2 inhibition reduced tumorigenesis in ApcMin/+ mice. Ly6G+ neutrophils were the dominant source of CXCR2 in blood, and CXCR2 deficiency attenuated neutrophil recruitment. Moreover, systemic Ly6G+ cell depletion purged CXCR2-dependent tumor-associated leukocytes, suppressed established skin tumor growth and colitis-associated tumorigenesis, and reduced ApcMin/+ adenoma formation. CXCR2 is thus a potent protumorigenic chemokine receptor that directs recruitment of tumor-promoting leukocytes into tissues during tumor-inducing and tumor-driven inflammation. Similar leukocyte populations were also found in human intestinal adenomas, which suggests that CXCR2 antagonists may have therapeutic and prophylactic potential in the treatment of cancer.
Figures
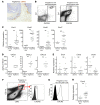
Figure 1. Expression of CXCR2 and its ligands in papillomas and blood.
Papillomas were induced on WT Balb/c mice using DMBA/TPA. (A) Representative papilloma section immunostained with anti-MPO Ab (brown). Original magnification, ×200. (B) Live peripheral blood leukocytes (left) and bone marrow (right) immunostained with anti-Gr1 and anti-CXCR2 Ab and analyzed by flow cytometry. Gates defining Gr1+CXCR2+ cells (boxes) were set using anti-Gr1– and anti-CXCR2–immunostained Cxcr2–/– peripheral blood leukocytes and bone marrow and isotype control–stained WT cells. (C) Relative abundance of transcripts for CXCR2 ligands in WT papillomas (determined by Q-RT-PCR). Mean of normal adjacent skin is set to 1. (D) CXCL1, CXCL2, and CXCL5 protein in lysates of WT papillomas and resting normal skin, measured by ELISA. (E) Relative abundance of transcripts for Cxcl1, Cxcl2, and Cxcl5 (determined by Q-RT-PCR) in stromal and tumor cells isolated from papillomas by LCM. Mean of stromal cells is set to 1. (F) Flow cytometry of a disaggregated papilloma (pregated for live cells) stained with anti-Ly6G and anti-CD11b Ab. Gate for CD11b+Ly6G+ cells (box) was defined using controls in which anti-Gr1 or anti-CD11b Ab had been replaced with an appropriate isotype control. Representative overlaid flow cytometry histogram plots of anti-CXCR2 (line) and isotype control (filled) immunostaining of CD11b+Ly6Ghi papilloma-associated cells are also shown. (G) As in F, but for CD11b+Ly6Ghi bone marrow cells. (H) As in C, but for Cxcr2. **P < 0.01, Mann-Whitney test.
Figure 2. CXCR2 deficiency suppresses TPA-induced epidermal proliferation and neutrophil recruitment to inflamed skin.
(A and B) Shaved back skin of WT Balb/c mice received TPA once (A), or 3 times per week for 2 weeks (B), and was harvested 12–48 hours after the final TPA treatment. Relative expression of Cxcr2 and its ligands was determined by Q-RT-PCR; the mean of shaved, untreated skin (0 hours) is set to 1. *P < 0.05, **P < 0.01, ***P < 0.001 versus untreated, 1-way ANOVA with multiple comparison post-test. (C) Representative sections of anti-MPO–immunostained (brown) WT and Cxcr2–/– Balb/c back skin 12 hours after a single TPA treatment. Sections were counterstained with hematoxylin and visualized by light microscopy. MPO+ cells in blood vessels are denoted by arrows. Original magnification, ×200. (D) Ki67+ epidermal cells in WT and Cxcr2–/– (KO) Balb/c back skin 6, 12, and 24 hours either after a single TPA treatment (acute), or after the last of 6 TPA applications spanning 2 weeks (chronic). The mean of the maximal WT response in each data set is set to 100%. *P < 0.05, ***P < 0.001, 1-way ANOVA with multiple comparison post-test.
Figure 3. CXCR2 deficiency suppresses DMBA/TPA skin carcinogenesis.
(A–C) WT and Cxcr2–/– Balb/c mice received DMBA once, followed 1 week later by 20 weeks of TPA treatment (3 times per week). Number of papillomas/mouse (A; mean ± SEM) and papilloma incidence (B) were recorded weekly. Tumors were measured at the end of the experiment (C). Data were analyzed by Mann-Whitney test (A at week 22 and C) and log-rank analysis with censoring (B). **P < 0.01. (D) Representative sections of anti-MPO–immunostained (brown) WT and Cxcr2–/– Balb/c DMBA/TPA-induced papillomas. Sections were counterstained with hematoxylin and visualized by light microscopy. Boxed regions are shown at higher magnification in the insets. Scale bars: 200 μm; 50 μm (insets). (E) Average number of MPO+ cells per high-powered field (HPF) of 6 papillomas taken from 4 or more mice of each genotype. ***P < 0.001, Mann-Whitney test. (F) Microvessel density in WT and Cxcr2–/– papillomas (n = 5–6 per group). *P < 0.05, Mann-Whitney test. Box and whisker plots show median (lines within boxes), interquartile range (bounds of boxes), and upper and lower range (whiskers).
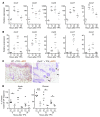
Figure 4. AOM/DSS-induced adenomas express CXCR2 ligands and are infiltrated by MPO+ cells.
WT Balb/c mice were treated once i.p. with AOM and then underwent 3 5-day periods of 2% DSS feeding, interspersed by 16 days on normal water. Animals were sacrificed 70 days after AOM injection. (A) Relative abundance of transcripts for Cxcr2 and its ligands in AOM/DSS-induced adenomas, as determined by Q-RT-PCR; mean expression in normal colon of untreated mice is set to 1. **P < 0.01, ***P < 0.001, Mann-Whitney test. (B) Representative adenoma section stained with anti-MPO Ab (brown), counterstained with hematoxylin, and visualized by light microscopy. Scale bar: 100 μm.
Figure 5. Cxcr2 deficiency protects against intestinal inflammation induced by 2% DSS.
WT and Cxcr2–/– mice were fed 2% DSS for 5 days and then normal water for a further 6 days. (A) Relative expression of Cxcr2 and its ligands in WT Balb/c colon during 2% DSS feeding, as determined by Q-RT-PCR; mean expression in colon of untreated control mice (UC) is set to 1. On refers to duration of 2% DSS feeding; Off refers to duration of return to normal water. *P < 0.05, **P < 0.01 versus untreated control, 1-way ANOVA with multiple comparison post-test. (B and C) Representative sections of colons from WT and Cxcr2–/– Balb/c mice immunostained with anti-MPO (B) or anti-BrdU (C) Ab (brown), either 2 days after returning to normal water or in the absence of DSS exposure. Mice were injected i.p. with BrdU 2 hours before harvest. Sections were counterstained with hematoxylin and visualized by light microscopy. The number of MPO+ cells per section of WT and Cxcr2–/– (KO) colons after 5 days of 2% DSS feeding and 2 days after return to normal water (n = 4 per group) is also shown in B. *P < 0.05, **P < 0.01, Mann-Whitney test. Scale bars: 200 μm (B and C). Box and whisker plots show median (lines within boxes), interquartile range (bounds of boxes), and upper and lower range (whiskers).
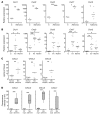
Figure 6. Cxcr2 deficiency suppresses AOM/DSS-induced adenoma formation.
WT and Cxcr2–/– mice were treated once i.p. with AOM and then underwent 3 5-day periods of 2% DSS feeding, interspersed by 16 days on normal water. Animals were sacrificed 70 days after AOM injection. (A) Number of colonic polyps per mouse, polyp size, and overall tumor burden per mouse (n as indicated). (B) Representative sections of AOM/DSS-induced adenomas from WT and Cxcr2–/– mice immunostained with anti-MPO (brown), counterstained with hematoxylin, and visualized by light microscopy. Number of MPO+ cells per high-powered field in sections of WT and Cxcr2–/– adenomas (n as indicated) is also shown. (C) Microvessel density in WT and Cxcr2–/– adenomas (n = 5–6 per group). **P < 0.01, ***P < 0.001, Mann-Whitney test. Box and whisker plots show median (lines within boxes), interquartile range (bounds of boxes), and upper and lower range (whiskers).
Figure 7. Genes encoding CXCR2 ligands are highly expressed by spontaneous intestinal tumors and form part of the secretome of ApcMin/+ adenomas.
(A and B) Relative mRNA expression of Cxcr2 and its ligands in tumors from ApcMin/+ (A) and AhCreER;Apcfl/+;Ptenfl/fl (B) mice. Tumors from AhCreER;Apcfl/+;Ptenfl/fl mice were harvested approximately 50 days after cre activation (4 i.p. injections of cre inducers) and categorized as invasive (Inv) or noninvasive based on examination of intestinal tissue and confirmed by microscopic examination of H&E-stained sections. Mean expression in adjacent normal tissue (C) is set to 1. (C) CXCL1, CXCL2, and CXCL5 protein in lysates of ApcMin/+ adenomas and resting normal intestine from C57BL/6 mice, measured by ELISA. (D) Mouse cytokine antibody arrays were exposed to conditioned media from cultures of WT intestinal crypts or ApcMin/+ adenomas, and fluorescence intensity on anti-CXCL1, -CXCL2, -CXCL5, and -CXCL7 Ab was read on a microarray scanner (n = 5 per group). *P < 0.05, **P < 0.01, ***P < 0.001, Mann-Whitney test (A, C, and D) or 1-way ANOVA with multiple comparison post-test (B). Box and whisker plots show median (lines within boxes), interquartile range (bounds of boxes), and upper and lower range (whiskers).
Figure 8. CXCR2+ and MPO+ cells infiltrate spontaneous intestinal tumors.
Representative adenomas from Apcmin/+ and AhCreER;Apcfl/+;Ptenfl/fl mice immunostained (brown) with Ab against CXCR2 (A) or MPO (B), counterstained with hematoxylin, and visualized by light microscopy. Tumors from AhCreER;Apcfl/+;Ptenfl/fl tumors were harvested approximately 50 days after cre activation (4 i.p. injections of cre inducers). The boxed region in B is shown at higher magnification in the inset. Original magnification, ×200; ×400 (higher-magnification view).
Figure 9. CXCR2 inhibition suppresses spontaneous formation of benign cancers in ApcMin/+ mice.
ApcMin/+ mice were treated with control or CXCR1/2 pepducin from 5 weeks of age and sacrificed 50 days later. (A) Number of polyps per mouse. (B) Number of MPO+ cells per polyp section. (C) Representative sections of adenomas from pepducin-treated Apcmin/+ mice were immunostained with Ab against MPO (brown), counterstained with hematoxylin, and visualized by light microscopy. Clusters of MPO+ cells are indicated by arrows. (D) Microvessel density of adenomas from pepducin-treated ApcMin/+ mice (n = 5–6 mice per group). **P < 0.01, ***P < 0.001, Mann-Whitney test. Box and whisker plots show median (lines within boxes), interquartile range (bounds of boxes), and upper and lower range (whiskers).
Figure 10. Cxcr2 deficiency suppresses intestinal adenocarcinoma formation.
Cohorts of AhCreER;Apcfl/+;Ptenfl/fl;Cxcr2+/+ (WT) and AhCreER;Apcfl/+;Ptenfl/fl;Cxcr2–/– (Cxcr2–/–) mice were injected i.p. on 4 consecutive days (A–C) or once (D) with cre inducers (tamoxifen and β-napthoflavone). Mice were sacrificed after 50 (A and B), 100 (C), or 200 (D) days. (A) Representative H&E-stained colonic rolls taken at low (×2.5; top) and high (×20; bottom) magnification. Arrows denote adenomas. Scale bars: 1,000 μm (top); 200 μm (bottom). (B and C) Number of polyps per mouse (n as indicated). (D) Polyps and tumor burden per mouse (n as indicated). The median value for AhCreER;Apcfl/+;Ptenfl/fl;Cxcr2–/– mice is 0. ***P < 0.001, Mann-Whitney test. Box and whisker plots show median (lines within boxes), interquartile range (bounds of boxes), and upper and lower range (whiskers).
Figure 11. Ly6G+ cell depletion suppresses AOM/DSS-induced and spontaneous intestinal tumorigenesis.
(A–C) WT Balb/c mice were injected with AOM and then underwent 2 5-day periods of 2% DSS feeding, interspersed by 16 days on normal water. From the start of the first DSS feed, groups of 10 mice were treated 3 times per week with either 1A8 (anti-Ly6G) or isotype control (2A3) Ab. (A) Number of colonic polyps per mouse, polyp size, and overall tumor burden per mouse. (B) Blood neutrophil counts, expressed as total and percentage, on the day of sacrifice (n = 5 [isotype]; 4 [1A8]). (C) Microvessel density in adenomas (n = 3 per group). (D–G) ApcMin/+ mice were treated 3 times per week with either 1A8 (anti-Ly6G) or isotype control (2A3) Ab from 5 weeks of age, and sacrificed 50 days later. (D) Number of polyps per mouse. (E) Representative sections of adenomas immunostained with Ab against MPO (brown), counterstained with hematoxylin, and visualized by light microscopy. Arrows denote clusters of MPO+ cells. Original magnification, ×200. (F) Number of MPO+ neutrophils per polyp section. (G) Microvessel density in adenomas (n = 5–6 per group). *P < 0.05, **P < 0.01, ***P < 0.001, Mann-Whitney test. Box and whisker plots show median (lines within boxes), interquartile range (bounds of boxes), and upper and lower range (whiskers).
Figure 12. Ly6G+ cell depletion suppresses growth of established papillomas.
Papilloma-bearing WT mice were treated 3 times per week for 2.5 weeks with 1A8 (anti-Ly6G) or isotype control (2A3) Ab. Papillomas were measured before and after Ab treatment. (A) Representative sections of papillomas immunostained with anti-MPO (brown), counterstained with hematoxylin, and visualized by light microscopy. (B) Increase in papilloma size and tumor burden over the course of Ab treatment. (C) Microvessel density (n = 5–6 per group). (D) Representative sections of papillomas immunostained with anti–cleaved caspase 3 Ab (brown), counterstained with hematoxylin, and visualized by light microscopy. Arrows denote cleaved caspase 3–positive cells. (E) Average number of cleaved caspase 3–positive cells per high-powered field. **P < 0.01, ***P < 0.01, Mann-Whitney test. Scale bars: 200 μm. Box and whisker plots show median (lines within boxes), interquartile range (bounds of boxes), and upper and lower range (whiskers).
Similar articles
- Inducible cutaneous inflammation reveals a protumorigenic role for keratinocyte CXCR2 in skin carcinogenesis.
Cataisson C, Ohman R, Patel G, Pearson A, Tsien M, Jay S, Wright L, Hennings H, Yuspa SH. Cataisson C, et al. Cancer Res. 2009 Jan 1;69(1):319-28. doi: 10.1158/0008-5472.CAN-08-2490. Cancer Res. 2009. PMID: 19118017 Free PMC article. - CXCR2 inhibition suppresses acute and chronic pancreatic inflammation.
Steele CW, Karim SA, Foth M, Rishi L, Leach JD, Porter RJ, Nixon C, Jeffry Evans TR, Carter CR, Nibbs RJ, Sansom OJ, Morton JP. Steele CW, et al. J Pathol. 2015 Sep;237(1):85-97. doi: 10.1002/path.4555. Epub 2015 Jun 4. J Pathol. 2015. PMID: 25950520 Free PMC article. - The premalignant nature of mouse skin papillomas: histopathologic, cytogenetic, and biochemical evidence.
Aldaz CM, Conti CJ. Aldaz CM, et al. Carcinog Compr Surv. 1989;11:227-42. Carcinog Compr Surv. 1989. PMID: 2465820 Review. No abstract available. - Combined anti CXC receptors 1 and 2 therapy is a promising anti-inflammatory treatment for respiratory diseases by reducing neutrophil migration and activation.
Planagumà A, Domènech T, Pont M, Calama E, García-González V, López R, Aulí M, López M, Fonquerna S, Ramos I, de Alba J, Nueda A, Prats N, Segarra V, Miralpeix M, Lehner MD. Planagumà A, et al. Pulm Pharmacol Ther. 2015 Oct;34:37-45. doi: 10.1016/j.pupt.2015.08.002. Epub 2015 Aug 10. Pulm Pharmacol Ther. 2015. PMID: 26271598 Review.
Cited by
- Myeloid-derived suppressor cells: The green light for myeloma immune escape.
Malek E, de Lima M, Letterio JJ, Kim BG, Finke JH, Driscoll JJ, Giralt SA. Malek E, et al. Blood Rev. 2016 Sep;30(5):341-8. doi: 10.1016/j.blre.2016.04.002. Epub 2016 Apr 12. Blood Rev. 2016. PMID: 27132116 Free PMC article. Review. - Phorbol ester-induced neutrophilic inflammatory responses selectively promote metastatic spread of melanoma in a TLR4-dependent manner.
Bald T, Landsberg J, Jansen P, Gaffal E, Tüting T. Bald T, et al. Oncoimmunology. 2015 Sep 1;5(2):e1078964. doi: 10.1080/2162402X.2015.1078964. eCollection 2016 Feb. Oncoimmunology. 2015. PMID: 27057457 Free PMC article. - IL8-CXCR2 pathway inhibition as a therapeutic strategy against MDS and AML stem cells.
Schinke C, Giricz O, Li W, Shastri A, Gordon S, Barreyro L, Bhagat T, Bhattacharyya S, Ramachandra N, Bartenstein M, Pellagatti A, Boultwood J, Wickrema A, Yu Y, Will B, Wei S, Steidl U, Verma A. Schinke C, et al. Blood. 2015 May 14;125(20):3144-52. doi: 10.1182/blood-2015-01-621631. Epub 2015 Mar 25. Blood. 2015. PMID: 25810490 Free PMC article. - Bladder cancer, inflammageing and microbiomes.
Martin A, Woolbright BL, Umar S, Ingersoll MA, Taylor JA 3rd. Martin A, et al. Nat Rev Urol. 2022 Aug;19(8):495-509. doi: 10.1038/s41585-022-00611-3. Epub 2022 Jul 7. Nat Rev Urol. 2022. PMID: 35798831 Review. - Improved mouse models and advanced genetic and genomic technologies for the study of neutrophils.
Hosur V, Skelly DA, Francis C, Low BE, Kohar V, Burzenski LM, Amiji MM, Shultz LD, Wiles MV. Hosur V, et al. Drug Discov Today. 2020 Jun;25(6):1013-1025. doi: 10.1016/j.drudis.2020.03.018. Epub 2020 May 5. Drug Discov Today. 2020. PMID: 32387410 Free PMC article. Review.
References
Publication types
MeSH terms
Substances
LinkOut - more resources
Full Text Sources
Other Literature Sources
Molecular Biology Databases


