Loss of p53 accelerates the complications of myelodysplastic syndrome in a NUP98-HOXD13-driven mouse model - PubMed (original) (raw)
Loss of p53 accelerates the complications of myelodysplastic syndrome in a NUP98-HOXD13-driven mouse model
Haiming Xu et al. Blood. 2012.
Abstract
The nucleoporin gene NUP98 is fused to several genes including HOXD13 in patients with myelodysplastic syndromes (MDS), acute myeloid leukemia, and chronic myeloid leukemia, blast crisis. Genetically engineered mice that express a NUP98-HOXD13 (NHD13) transgene (Tg) display the phenotypic features of MDS, including cytopenias, bone marrow dysplasia, and transformation to acute leukemia. Here we show that short-term treatment with the p53 inhibitor Pifithrin-α partially and transiently rescued the myeloid and lymphoid abnormalities found in NHD13(+) Tg mice, with no improvement in the anemia, while the genetic deletion of 2 alleles of p53 rescued both the myeloid progenitor cell and long-term hematopoietic stem cell compartments. Nonetheless, loss of one or both alleles of p53 did not rescue the MDS phenotype, but instead exacerbated the MDS phenotype and accelerated the development of acute myeloid leukemia. Our studies suggest that while targeting p53 may transiently improve hematopoiesis in MDS, over the long-term, it has detrimental effects, raising caution about abrogating its function to treat the cytopenias that accompany this disease.
Figures
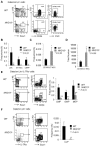
Figure 1
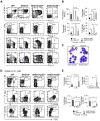
HSPC frequencies in NHD13+ Tg and control mice. Bone marrow (BM) cells from wild-type and NHD13+ Tg mice were harvested at 4 months of age and prepared for flow cytometric analysis. (A) Representative FACS plots show LSK, CD34, Flt3, and CD150 expression within WT and NHD13+ Tg mice BM cells. (B) The frequencies of LSK cells, ST-HSCs (LSKCD34+Flt3−) and LMPPs (LSKCD34+Flt3+) in WT and NHD13+ Tg mouse BM (mean ± SD, n = 7, *P < .05, **P < .01). (C) The frequency and (D) absolute number of CD150+ LT-HSCs (CD150+LSKCD34−Flt3−) in WT and NHD13+ Tg mouse BM are shown (mean ± SD, n = 7, *P < .05). (E left panel) The FACS plots and gating strategies used to identify CMPs (Lin−Sca-1− cKit+ IL-7Rα−CD34+FcgRlow), GMPs (Lin−Sca-1−cKit+IL-7Rα−CD34+FcgRhigh), and MEPs (Lin−Sca-1−cKit+IL-7Rα−CD34−FcgRlow) within the Lin−IL-7Rα−cKit+ population. Right panel, The frequencies of CMPs, GMPs, and MEPs in WT and NHD13+ Tg mice BM (mean ± SD, n = 8, **P < .01). (F left panel) Representative FACS plots of the gating strategy to identify the CLPs (Flt3+Lin−IL-7Rα+ckitintSca-1int) population. (Right panel) The frequency of CLPs in WT and NHD13+ Tg mice BM (mean ± SD, n = 8, **P < .01).
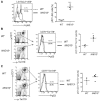
Figure 2
Increased p53 level in NHD13+ bone marrow cells. The intracellular p53 level was measured by flow cytometry. (A) Representative FACS profiles of p53 protein levels in WT (gray) and NHD13+ Tg (black) mouse bone marrow (BM) LSK (Lin−Sca-1+cKit+) cells. The graph on the right indicates the mean percentage of p53+ cells present (n = 5, ***P < .001). (B) Representative FACS profiles of p53 protein levels in WT (gray) and NHD13+ Tg (black) mice BM CD71+Ter119− cells. The bar graph on the right indicates the mean percentage of p53+ cells present (n = 5, *P < .05). (C) Representative FACS profiles of p53 protein levels in WT (gray) and NHD13+ Tg (black) mice BM CD71+Ter119+ cells. Data shown on the right are the mean percentage of p53+ cells present (n = 5, P = .052).
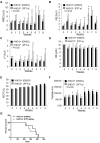
Figure 3
The effects of PFT-α treatment on NHD13+ Tg mice. NHD13+ Tg mice at the MDS stage (∼ 5 months of age) were intraperitoneally injected daily with DMSO vehicle or PFT-α (2 mg/kg body weight) for 8 weeks. Peripheral blood was collected weekly. (A) The white blood cell (WBC) counts, (B) neutrophil (NE) counts, (C) lymphocyte (LY) counts, (D) hemoglobin (HB) value, (E) mean corpuscular volume (MCV), and (F) platelet counts are shown (mean ± SD, n = 5 mice/group, *P < .05). (G) Kaplan-Meier survival curves of NHD13+ mice treated with DMSO vehicle or PFT-α (2 mg/kg body weight) for 8 weeks (n = 5 mice/group).
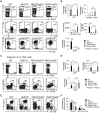
Figure 4
The loss of 1 or 2 p53 alleles does not rescue the MDS phenotype induced by NHD13 fusion protein. (A) Representative staining profiles for LSK cells, CD34, Flt3, and CD150 expression within BM cells of NHD13+, NHD13+p53+/−, and NHD13+p53−/− mice with MDS, compared with WT controls. (B) The frequencies of LSK cells, ST-HSCs, LMPPs, CD150+ LT-HSCs, and the total number of CD150+ LT-HSCs in NHD13+, NHD13+p53+/−, and NHD13+_p53_−/− mice with MDS are compared with WT control mice (mean ± SD, *P < .05, **P < .01). (C) Representative FACS profiles for CMPs (Lin−Sca-1− cKit+ IL-7Rα−CD34+FcgRlow), GMPs (Lin−Sca-1−cKit+IL-7Rα−CD34+FcgRhigh), and MEPs (Lin−Sca-1−cKit+IL-7Rα−CD34−FcgRlow) within the Lin−IL-7Rα−cKit+ population for the NHD13+, NHD13+p53+/−, and NHD13+_p53_−/− mice with MDS, compared with the WT control mice. (D) The frequencies of CMPs, GMPs, and MEPs in the NHD13+, NHD13+p53+/−, and NHD13+_p53_−/− mice with MDS, compared with WT control mice (mean ± SD, *P < .05, **P < .01). (E) Representative FACS profiles showing CD71 and Ter119 staining of BM cells isolated from NHD13+, NHD13+p53+/−, and NHD13+_p53_−/− mice with MDS, compared with WT control. (F) The frequencies of Ter119+ and CD71−Ter119+ cells in the NHD13+, NHD13+p53+/−, and NHD13+_p53_−/− mice with MDS, compared with WT controls (mean ± SD, *P < .05, **P < .01). The mice used for this figure were between 4 and 5 months old; n = 8 for each genotype.
Figure 5
The inactivation of p53 decreases the survival of NHD13+ Tg mice with MDS or AML. (A) Kaplan-Meier survival curves for the NHD13+ (n = 23), NHD13+p53+/− (n = 25), NHD13+_p53_−/− (n = 18) mice with MDS or AML, and the p53+/− (n = 24), _p53_−/− (n = 23) control mice are shown. The P value represents the comparison of survival between the NHD13+_p53_−/− and _p53_−/− mice, or a comparison of survival between NHD13+p53+/− and p53+/− mice (***P < .001). (B) Survival curves for the NHD13+ (n = 23), NHD13+p53+/− (n = 25), and NHD13+_p53_−/− (n = 18) mice with MDS or AML. The P value represents a comparison of survival between the NHD13+_p53_−/− and NHD13+ mice, or between the NHD13+p53+/− and the NHD13+ mice (***P < .001). (C) Survival curves for the NHD13+ (n = 7), NHD13+p53+/− (n = 14), and NHD13+_p53_−/− (n = 10) mice with MDS. The P value represents the comparison of survival between NHD13+_p53_−/− and NHD13+ MDS mice (***P < .001). (D) Survival curves for the NHD13+ (n = 16), NHD13+p53+/− (n = 11), and NHD13+_p53_−/− (n = 8) mice with AML. The P value represents a comparison of survival between NHD13+_p53_−/− and NHD13+ mice, or between NHD13+p53+/− and NHD13+ mice (***P < .001).
Figure 6
The loss of one or two p53 alleles accelerates the development of AML. (A) Representative FACS profiles show Mac-1 and Gr-1, c-Kit and Sca-1, c-Kit and Mac-1, c-Kit and Gr-1staining of BM cells isolated from NHD13+, NHD13+p53+/−, and NHD13+_p53_−/− mice with AML, compared with WT control mice. (B) The frequencies of Mac-1+ or Gr-1+, c-Kit+Sca-1−, Mac-1+c-Kit+, and Gr-1+c-Kit+ cells in NHD13+, NHD13+p53+/−, and NHD13+_p53_−/− mouse BM with AML, compared with WT control mice (mean ± SD, *P < .05, **P < .01). (C) Representative H&E-stained BM cytospin samples from NHD13+, NHD13+p53+/−, and NHD13+_p53_−/− mice with AML compared with WT control. (D) Representative staining profiles for LSK cells, showing also CD34, Flt3, and CD150 expression within the BM of NHD13+, NHD13+p53+/−, and NHD13+_p53_−/− mice with AML, compared with WT controls. (E) The frequencies of LSK cells, CD150+ LT-HSCs, ST-HSCs, and LMPPs in NHD13+, NHD13+p53+/−, and NHD13+_p53_−/− mice with AML, compared with WT control mice (mean ± SD, *P < .05, **P < .01). The mice used for this figure: NHD13+ mice with AML (n = 10, age between 9 months to 12 months), NHD13+p53+/− mice with AML (n = 10, age between 5 months to 10 months), NHD13+_p53_−/− mice with AML (n = 8, age between 4 and 6 months), and WT control (n = 6, age between 4 and 7 months).
Similar articles
- SETD2 deficiency accelerates MDS-associated leukemogenesis via S100a9 in NHD13 mice and predicts poor prognosis in MDS.
Chen BY, Song J, Hu CL, Chen SB, Zhang Q, Xu CH, Wu JC, Hou D, Sun M, Zhang YL, Liu N, Yu PC, Liu P, Zong LJ, Zhang JY, Dai RF, Lan F, Huang QH, Zhang SJ, Nimer SD, Chen Z, Chen SJ, Sun XJ, Wang L. Chen BY, et al. Blood. 2020 Jun 18;135(25):2271-2285. doi: 10.1182/blood.2019001963. Blood. 2020. PMID: 32202636 Free PMC article. - PUMA promotes apoptosis of hematopoietic progenitors driving leukemic progression in a mouse model of myelodysplasia.
Guirguis AA, Slape CI, Failla LM, Saw J, Tremblay CS, Powell DR, Rossello F, Wei A, Strasser A, Curtis DJ. Guirguis AA, et al. Cell Death Differ. 2016 Jun;23(6):1049-59. doi: 10.1038/cdd.2015.159. Epub 2016 Jan 8. Cell Death Differ. 2016. PMID: 26742432 Free PMC article. - Depletion of cytotoxic T-cells does not protect NUP98-HOXD13 mice from myelodysplastic syndrome but reveals a modest tumor immunosurveillance effect.
Gough SM, Chung YJ, Aplan PD. Gough SM, et al. PLoS One. 2012;7(5):e36876. doi: 10.1371/journal.pone.0036876. Epub 2012 May 11. PLoS One. 2012. PMID: 22606303 Free PMC article. - Molecular bases of myelodysplastic syndromes: lessons from animal models.
Komeno Y, Kitaura J, Kitamura T. Komeno Y, et al. J Cell Physiol. 2009 Jun;219(3):529-34. doi: 10.1002/jcp.21739. J Cell Physiol. 2009. PMID: 19259975 Review. - [Clinical picture and molecular disorders in myelodysplastic (MDP) syndromes].
Rupniewska ZM. Rupniewska ZM. Pol Arch Med Wewn. 1992 Mar;87(3):197-208. Pol Arch Med Wewn. 1992. PMID: 1523148 Review. Polish. No abstract available.
Cited by
- Disclosing the Interactome of Leukemogenic NUP98-HOXA9 and SET-NUP214 Fusion Proteins Using a Proteomic Approach.
Mendes A, Jühlen R, Bousbata S, Fahrenkrog B. Mendes A, et al. Cells. 2020 Jul 10;9(7):1666. doi: 10.3390/cells9071666. Cells. 2020. PMID: 32664447 Free PMC article. - Bridge-Induced Translocation between NUP145 and TOP2 Yeast Genes Models the Genetic Fusion between the Human Orthologs Associated With Acute Myeloid Leukemia.
Tosato V, West N, Zrimec J, Nikitin DV, Del Sal G, Marano R, Breitenbach M, Bruschi CV. Tosato V, et al. Front Oncol. 2017 Sep 29;7:231. doi: 10.3389/fonc.2017.00231. eCollection 2017. Front Oncol. 2017. PMID: 29034209 Free PMC article. - Nucleoporin genes in human diseases.
Nofrini V, Di Giacomo D, Mecucci C. Nofrini V, et al. Eur J Hum Genet. 2016 Oct;24(10):1388-95. doi: 10.1038/ejhg.2016.25. Epub 2016 Apr 13. Eur J Hum Genet. 2016. PMID: 27071718 Free PMC article. Review. - Recent advances in the understanding and treatment of acute myeloid leukemia.
Watts J, Nimer S. Watts J, et al. F1000Res. 2018 Aug 6;7:F1000 Faculty Rev-1196. doi: 10.12688/f1000research.14116.1. eCollection 2018. F1000Res. 2018. PMID: 30135719 Free PMC article. Review. - Epigenetically Aberrant Stroma in MDS Propagates Disease via Wnt/β-Catenin Activation.
Bhagat TD, Chen S, Bartenstein M, Barlowe AT, Von Ahrens D, Choudhary GS, Tivnan P, Amin E, Marcondes AM, Sanders MA, Hoogenboezem RM, Kambhampati S, Ramachandra N, Mantzaris I, Sukrithan V, Laurence R, Lopez R, Bhagat P, Giricz O, Sohal D, Wickrema A, Yeung C, Gritsman K, Aplan P, Hochedlinger K, Yu Y, Pradhan K, Zhang J, Greally JM, Mukherjee S, Pellagatti A, Boultwood J, Will B, Steidl U, Raaijmakers MHGP, Deeg HJ, Kharas MG, Verma A. Bhagat TD, et al. Cancer Res. 2017 Sep 15;77(18):4846-4857. doi: 10.1158/0008-5472.CAN-17-0282. Epub 2017 Jul 6. Cancer Res. 2017. PMID: 28684528 Free PMC article.
References
- Nimer SD. Myelodysplastic syndromes. Blood. 2008;111(10):4841–4851. - PubMed
- Greenberg P, Cox C, LeBeau MM, et al. International scoring system for evaluating prognosis in myelodysplastic syndromes. Blood. 1997;89(6):2079–2088. - PubMed
- Horiike S, Kita-Sasai Y, Nakao M, Taniwaki M. Configuration of the TP53 gene as an independent prognostic parameter of myelodysplastic syndrome. Leuk Lymphoma. 2003;44(6):915–922. - PubMed
- Kaneko H, Misawa S, Horiike S, Nakai H, Kashima K. TP53 mutations emerge at early phase of myelodysplastic syndrome and are associated with complex chromosomal abnormalities. Blood. 1995;85(8):2189–2193. - PubMed
Publication types
MeSH terms
Substances
LinkOut - more resources
Full Text Sources
Medical
Molecular Biology Databases
Research Materials
Miscellaneous
