TPC proteins are phosphoinositide- activated sodium-selective ion channels in endosomes and lysosomes - PubMed (original) (raw)
. 2012 Oct 12;151(2):372-83.
doi: 10.1016/j.cell.2012.08.036.
Xiaoli Zhang, Xian-Ping Dong, Mohammad Samie, Xinran Li, Xiping Cheng, Andrew Goschka, Dongbiao Shen, Yandong Zhou, Janice Harlow, Michael X Zhu, David E Clapham, Dejian Ren, Haoxing Xu
Affiliations
- PMID: 23063126
- PMCID: PMC3475186
- DOI: 10.1016/j.cell.2012.08.036
TPC proteins are phosphoinositide- activated sodium-selective ion channels in endosomes and lysosomes
Xiang Wang et al. Cell. 2012.
Abstract
Mammalian two-pore channel proteins (TPC1, TPC2; TPCN1, TPCN2) encode ion channels in intracellular endosomes and lysosomes and were proposed to mediate endolysosomal calcium release triggered by the second messenger, nicotinic acid adenine dinucleotide phosphate (NAADP). By directly recording TPCs in endolysosomes from wild-type and TPC double-knockout mice, here we show that, in contrast to previous conclusions, TPCs are in fact sodium-selective channels activated by PI(3,5)P(2) and are not activated by NAADP. Moreover, the primary endolysosomal ion is Na(+), not K(+), as had been previously assumed. These findings suggest that the organellar membrane potential may undergo large regulatory changes and may explain the specificity of PI(3,5)P(2) in regulating the fusogenic potential of intracellular organelles.
Copyright © 2012 Elsevier Inc. All rights reserved.
Figures
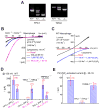
Figure 1. PI(3,5)P2 activates endogenous TRPML1-independent inward currents in endolysosomes
(A). Illustration of the whole-endolysosome recording configuration. Pipette (luminal) solution was a standard external (modified Tyrode’s) solution adjusted to pH 4.6 to mimic the acidic environment of the lysosomal lumen. Bath (internal/cytoplasmic) solution was a K+-based internal solution (140 mM K+-gluconate). Note that the inward current indicates cations flowing out of the endolysosome (arrow). (B). Bath application of PI(3,5)P2 (diC8, 1 μM) to the cytoplasmic side of enlarged endolysosome/vacuoles isolated from vacuolin-treated WT primary macrophage cells activated whole-endolysosome currents (296 ± 28pA/pF at −120mV, n = 24 vacuoles/endolysosomes) with positive Erev (79 ± 2.4mV, n = 20). K+-based cytoplasmic/bath solution contained (in mM) 140K+/4Na+/2Mg2+ (pH 7.2, free Ca2+ ~ 100 nM); luminal/pipette solution was a pH 4.6 modified Tyrode solution, which contained (in mM) 145Na+/5K+/1Mg2+/2 Ca2+ (pH 4.6); the equilibrium potential of Na+ (ENa) was estimated to be ~ +90mV. Inwardly rectifying TRPML-like currents (_I_TRPML-L) with Erev = 3.7 ± 1.7 mV (n = 20) were induced by a TRPML-specific small molecule agonist (SF-51) in the same vacuoles (blue trace). (C). PI(3,5)P2 activated a current with a positive Erev in an enlarged endolysosome/vacuole isolated from a TRPML1−/− primary macrophage cell. (D). PI(3,5)P2 (10 μM) activated whole-endolysosome current (from 30 to 420 pA measured at −120 mV) with positive Erev in enlarged endolysosome/vacuoles isolated from non-transfected COS-1 cells. Note the small _I_TRPML-L (Erev ~ 0mV) activated by SF-51 in the same vacuoles. Data are presented as the mean ± standard error of the mean (SEM). See also Figure S1.
Figure 2. PI(3,5)P2 activates recombinant TPCs in endolysosomes
(A). TPC2 proteins are localized in Lamp1-positive late endosomes and lysosomes in COS-1 cells that were transfected with TPC2 and Lamp-1 fusion proteins and treated with vacuolin-1. (B). PI(3,5)P2 activated a large whole-endolysosome current with Erev > + 80mV in an EGFP (hTPC2)-positive endolysosome isolated from an _hTPC2-EGFP_-transfected COS-1 cell. Whole-endolysosome currents were elicited by repeated voltage ramps (−140 to +140 mV; 400 ms) with a 4s interval between ramps; current amplitudes measured at −140 mV were used to plot the time course of activation. The right panel shows representative I-V traces of hTPC2-mediated whole-endolysosome currents (_I_hTPC2) before (red; −20 ± 4pA/pF at −120 mV, n = 9) and after (black and blue) PI(3,5)P2 bath application at three different time points, as indicated in the left panel (red, blue and black circles). Only a portion of the voltage protocol is shown; holding potential (HP) = 0 mV. (C). Dose-dependence of PI(3,5)P2-dependent activation (EC50 = 390 ± 94 nM, Hill slope (n) = 0.9, n= 13 vacuoles). (D). Specific activation of TPC2 by PI(3,5)P2 (in 1 μM), but not other PIPs (all in 10 μM). On average, _I_TPC2 in the presence of 1μM PI(3,5)P2 was 1410 ± 360pA/pF at −120mV (n = 7). (E). Activation of _I_hTPC1 by 1 μM PI(3,5)P2. Data are presented as the mean ± SEM. See also Figure S2.
Figure 3. PI(3,5)P2-activated TPC currents are Na+-selective
(A). PI(3,5)P2-activated _I_TPC2 (Erev= + 89 mV ± 5mV, n = 8) under bi-ionic conditions with luminal/pipette Na+ and cytoplasmic/bath K+. Large outward _I_hTPC2 was observed in cytoplasmic Na+. (B). _I_mTPC2 Erev (−68 ± 3mV, n = 5) under bi-ionic conditions with luminal K+ and cytoplasmic Na+. (C). Relative cationic permeability ratios of _I_hTPC2 based on Erev measurement under bi-ionic conditions. (D). Na+-dependence of _I_hTPC2 Erev. The left panel shows I-V relations of _I_hTPC2 with cytoplasmic solutions containing various concentrations of Na+ and K+. (E). Distinct inactivation kinetics of _I_hTPC2 and _I_hTPC1 at −120 mV. (F). Verapamil inhibited outward and inward _I_hTPC2 with different dose-dependencies under luminal and cytoplasmic symmetric Na+ (luminal pH 7.4). Data are presented as the mean ± SEM. See also Figure S3.
Figure 4. Na+ is the major cation in the lysosome
(A). Western blotting was performed for each fraction (A–G) using various organelle markers: Lamp-1 for the lysosome; annexin-V for the plasma membrane; complex II for the mitochondria; GM-130 for the Golgi; EEA1 for the early endosome. Cellular fractionation protocol is described in Suppl. Fig. S4. Centrifugation of cell homogenate (fraction A) of HEK293T cells resulted in a pellet (fraction B) and a supernatant (fraction C). The supernatant was then layered over a discontinued gradient containing a cushion of 2.5 M sucrose and 18% Percoll in the HM buffer. Further centrifugation of the gradient resulted in the light membrane fraction (fraction D), the medium membrane fraction (fraction E), and the heavy membrane fraction (fraction G). Lower panel: fraction G was then layered over a discontinuous iodixonal (8–27%) gradient (fractions 1–11); Western blotting was performed for each fraction using Anti-Lamp-1 and Anti- complex II. (B). Ionic composition (Na+, K+, and Ca2+) in the lysosomal lumen of HEK293T cells determined by Inductively Coupled Plasma Mass Spectrometry (ICP-MS). Right panel: estimated concentrations of Na+, K+, and Ca2+ in the lysosome lumen; estimates were based on the assumptions that the lysosome lumen is iso-osmotic relative to the cytosol, and all the cations are osmotically-active. (C). Luminal K+/Na+ ratios were significantly increased for isolated lysosomes that were treated with PI(3,5)P2 (20 μM), but not PI(4,5)P2 (20 μM). (D). Left panel: application of PI(3,5)P2 (red), but not PI(4,5)P2 (blue) to isolated lysosomes decreased Sodium Green, but not mCherry fluorescence. Lysosomes were isolated from TPC2-mCherry-expressing HEK293 cells and loaded with Sodium Green dyes. “Control” and “Negative” indicate fluorescence levels in isolated lysosomes with and without Sodium Green dye loading, respectively. Right panel: decreased Sodium Green fluorescence intensity (reflecting luminal Na+ concentration) from PI(3,5)P2-treated lysosomes; data are presented as the percentage of lysosomes that were Sodium Green-positive. mCherry fluorescence remained constant upon PI(3,5)P2/PI(4,5)P2 application. (E). _I_TPC2 measured in lysosome-attached configuration. _I_TPC2 was activated in the lysosome-attached configuration with PI(3,5)P2 (10 μM) in the K+ pipette solution. _I_TPC2 was detected with luminal Na+, but not K+ upon excision into the luminal-side-out configuration. Note that the indicated voltages in the lysosome-attached configuration contained a contribution from the lysosomal membrane potential, for which no accurate measurement is available. The smaller current amplitude seen in the lysosome-attached configuration might be due to luminal [Na+] lower than 160 mM, relief from luminal inhibition, or both. Data are presented as the mean ± SEM. See also Figure S4.
Figure 5. Genetic inactivation of TPC1 and TPC2 abolishes TPC currents in the endolysosome
(A). PCR genotyping of TPC1 KO (TPC1−/−) and TPC2 KO (TPC2−/−) mice. (B). Lack of significant PI(3,5)P2-activated TPC-like current (_I_TPC-L) in vacuoles isolated from a TPC1−/−/TPC2−/− mouse macrophage. Instead, in 15/15 vacuoles, PI(3,5)P2 activated _I_TRPML-L that was further potentiated by SF-51. (C). An endogenous _I_TPC-L activated by PI(3,5)P2 (1 μM) in a vacuole isolated from a WT mouse macrophage cell. Switching the cytoplasmic solution from K+ to Na+ resulted in a leftward shift of Erev, and an increase of the current in the outward direction. (D). Summary of _I_TPC-L and _I_TRPML-L in WT, TPC1−/−/TPC2−/−, and TRPML1−/− macrophages. (E). Summary of PI(3,5)P2-activated whole-endolysosome inward currents in WT, TPC1−/−/TPC2−/−, and TRPML1−/− macrophages at −30mV. _I_PIP2 was 107 ± 23pA/pF (n= 18) and 0.7 ± 0.4pA/pF (n=10) for WT and TPC1−/−/TPC2−/− macrophages, respectively. Data are presented as the mean ± SEM. See also Figure S5.
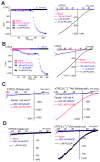
Figure 6. NAADP does not activate TPCs
(A). NAADP (100 nM or 1 μM) failed to activate whole-endolysosome _I_hTPC2. In contrast, PI(3,5)P2 robustly activated _I_hTPC2 in the same vacuole. The right panel shows representative I-V traces of whole-endolysosome currents at 4 different time points (indicated by color-coded circles) shown in the left panel. (B). NAADP (1 μM) failed to modulate PI(3,5)P2–activated _I_hTPC2. (C). Pipette dialysis of PI(3,5)P2 (200 μM) or NAADP (500 nM) failed to elicit whole-cell current in HEK293T cells transfected with WT hTPC2. In contrast, pipette dialysis of PI(3,5)P2 (200 μM), but not NAADP (500 nM), activated whole-cell _I_TPC2 in HEK293T cells transfected with a surface-expressed hTPC2 mutant (hTPC2-L11L12/AA). (D). PI(3,5)P2, but not NAADP, activated _I_TPC2-LL-AA in inside-out macro-patches isolated from hTPC2-L11L12/AA -transfected HEK293T cells. Data are presented as the mean ± SEM. See also Figure S6.
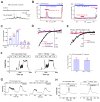
Figure 7. NAADP induces lysosomal Ca2+ release in cells that lack TPC currents or proteins
(A). Pipette dialysis of NAADP (100 nM) induced membrane depolarization and spike generation in an INS1 pancreatic β-cell line under the whole-cell current-clamp configuration. (B). In the absence of external Ca2+ (free [Ca2+] < 10 nM), NAADP-AM (100 μM) induced Ca2+ release measured with Fura-2 (F340/F380) ratios from intracellular stores in INS1 cells; Ned-19 (50 μM) abolished the majority of the NAADP-induced response. **(C).** Average peak Ca2+ responses induced by NAADP-AM (1, 10, 100 μM) with and without Ned-19 and Baf-A1 (500 nM). Percentage (from a total of 100–400 cells) of responding (ΔFura-2> 0.02) cells; the number of the responding cells are indicated. (D). NAADP (100 nM or 1 μM) failed to induce measurable whole-endolysosomal current in a vacuole isolated from an INS1 cell; PI(3,5)P2 activated large _I_TRPML-L (Erev =3.4 ± 3 mV, n=14; the ratio of current amplitudes at − 30 mV versus −120 mV was ~ 1%) in the same vacuole. (E). PI(3,5)P2 activated _I_TRPML-L in a vacuole from a WT primary pancreatic β-cell. (F). TPC1−/−/TPC2−/− primary pancreatic islets exhibit normal concentration-dependent glucose-induced Ca2+ responses. Cytosolic [Ca2+] increased significantly in both WT and TPC1−/−/TPC2−/− pancreatic islets in response to elevations of the glucose concentration (in mM; 1, 5, 8, 15; G1, G5, G8, and G15) in the perfusion solution (2.5 mM Ca2+). The traces shown are representative of 19 WT and 16 TPC1−/−/TPC2−/− islets, respectively. The right panel shows the average peak Ca2+ responses induced by 15 mM glucose (G15) in WT and TPC1−/−/TPC2−/− pancreatic islets. (G). Glucose-induced Ca2+ responses in WT and TPC1−/−/TPC2−/− pancreatic islets were inhibited by Ned-19 (100 μM). The traces shown are representative of the results obtained in 7 WT and 7 TPC1−/−/TPC2−/− islets, respectively. (H). NAADP-AM (200 μM) induced bi-phasic Ca2+ increases in the presence of 3 mM glucose (Yamasaki et al., 2004) in both WT and TPC1−/−/TPC2−/− islets. Traces shown are representative of the results obtained in 2 WT and 3 TPC1−/−/TPC2−/− islets, respectively. Data are presented as the mean ± SEM. See also Figure S7.
Similar articles
- Activation of endo-lysosomal two-pore channels by NAADP and PI(3,5)P2. Five things to know.
Patel S, Yuan Y, Gunaratne GS, Rahman T, Marchant JS. Patel S, et al. Cell Calcium. 2022 May;103:102543. doi: 10.1016/j.ceca.2022.102543. Epub 2022 Jan 25. Cell Calcium. 2022. PMID: 35123238 Free PMC article. Review. - Nicotinic Acid Adenine Dinucleotide Phosphate (NAADP) and Endolysosomal Two-pore Channels Modulate Membrane Excitability and Stimulus-Secretion Coupling in Mouse Pancreatic β Cells.
Arredouani A, Ruas M, Collins SC, Parkesh R, Clough F, Pillinger T, Coltart G, Rietdorf K, Royle A, Johnson P, Braun M, Zhang Q, Sones W, Shimomura K, Morgan AJ, Lewis AM, Chuang KT, Tunn R, Gadea J, Teboul L, Heister PM, Tynan PW, Bellomo EA, Rutter GA, Rorsman P, Churchill GC, Parrington J, Galione A. Arredouani A, et al. J Biol Chem. 2015 Aug 28;290(35):21376-92. doi: 10.1074/jbc.M115.671248. Epub 2015 Jul 7. J Biol Chem. 2015. PMID: 26152717 Free PMC article. - NAADP-Dependent TPC Current.
Wang Q, Zhu MX. Wang Q, et al. Handb Exp Pharmacol. 2023;278:35-56. doi: 10.1007/164_2022_606. Handb Exp Pharmacol. 2023. PMID: 35902437 - Purified TPC isoforms form NAADP receptors with distinct roles for Ca(2+) signaling and endolysosomal trafficking.
Ruas M, Rietdorf K, Arredouani A, Davis LC, Lloyd-Evans E, Koegel H, Funnell TM, Morgan AJ, Ward JA, Watanabe K, Cheng X, Churchill GC, Zhu MX, Platt FM, Wessel GM, Parrington J, Galione A. Ruas M, et al. Curr Biol. 2010 Apr 27;20(8):703-9. doi: 10.1016/j.cub.2010.02.049. Epub 2010 Mar 25. Curr Biol. 2010. PMID: 20346675 Free PMC article. - Calcium signaling via two-pore channels: local or global, that is the question.
Zhu MX, Ma J, Parrington J, Calcraft PJ, Galione A, Evans AM. Zhu MX, et al. Am J Physiol Cell Physiol. 2010 Mar;298(3):C430-41. doi: 10.1152/ajpcell.00475.2009. Epub 2009 Dec 16. Am J Physiol Cell Physiol. 2010. PMID: 20018950 Free PMC article. Review.
Cited by
- The Lysosome as a Regulatory Hub.
Perera RM, Zoncu R. Perera RM, et al. Annu Rev Cell Dev Biol. 2016 Oct 6;32:223-253. doi: 10.1146/annurev-cellbio-111315-125125. Epub 2016 Aug 3. Annu Rev Cell Dev Biol. 2016. PMID: 27501449 Free PMC article. Review. - A model of lysosomal pH regulation.
Ishida Y, Nayak S, Mindell JA, Grabe M. Ishida Y, et al. J Gen Physiol. 2013 Jun;141(6):705-20. doi: 10.1085/jgp.201210930. J Gen Physiol. 2013. PMID: 23712550 Free PMC article. - Activation of endo-lysosomal two-pore channels by NAADP and PI(3,5)P2. Five things to know.
Patel S, Yuan Y, Gunaratne GS, Rahman T, Marchant JS. Patel S, et al. Cell Calcium. 2022 May;103:102543. doi: 10.1016/j.ceca.2022.102543. Epub 2022 Jan 25. Cell Calcium. 2022. PMID: 35123238 Free PMC article. Review. - TPC Functions in the Immune System.
Steiner P, Arlt E, Boekhoff I, Gudermann T, Zierler S. Steiner P, et al. Handb Exp Pharmacol. 2023;278:71-92. doi: 10.1007/164_2022_634. Handb Exp Pharmacol. 2023. PMID: 36639434 - A Structural Overview of TRPML1 and the TRPML Family.
Fine M, Li X. Fine M, et al. Handb Exp Pharmacol. 2023;278:181-198. doi: 10.1007/164_2022_602. Handb Exp Pharmacol. 2023. PMID: 35879577
References
- Anzai K, Masumi M, Kawasaki K, Kirino Y. Frequent fusion of liposomes to a positively charged planar bilayer without calcium ions. J Biochem. 1993;114:487–491. - PubMed
- Carrithers MD, Dib-Hajj S, Carrithers LM, Tokmoulina G, Pypaert M, Jonas EA, Waxman SG. Expression of the voltage-gated sodium channel NaV1.5 in the macrophage late endosome regulates endosomal acidification. J Immunol. 2007;178:7822–7832. - PubMed
Publication types
MeSH terms
Substances
Grants and funding
- R01 GM081658/GM/NIGMS NIH HHS/United States
- R01 NS055293/NS/NINDS NIH HHS/United States
- R01 NS062792/NS/NINDS NIH HHS/United States
- R01 NS074257/NS/NINDS NIH HHS/United States
LinkOut - more resources
Full Text Sources
Other Literature Sources
Molecular Biology Databases
Research Materials
Miscellaneous


