The requirement for cyclin D function in tumor maintenance - PubMed (original) (raw)
The requirement for cyclin D function in tumor maintenance
Yoon Jong Choi et al. Cancer Cell. 2012.
Abstract
D-cyclins represent components of cell cycle machinery. To test the efficacy of targeting D-cyclins in cancer treatment, we engineered mouse strains that allow acute and global ablation of individual D-cyclins in a living animal. Ubiquitous shutdown of cyclin D1 or inhibition of cyclin D-associated kinase activity in mice bearing ErbB2-driven mammary carcinomas triggered tumor cell senescence, without compromising the animals' health. Ablation of cyclin D3 in mice bearing Notch1-driven T cell acute lymphoblastic leukemias (T-ALL) triggered tumor cell apoptosis. Such selective killing of leukemic cells can also be achieved by inhibiting cyclin D associated kinase activity in mouse and human T-ALL models. Inhibition of cyclin D-kinase activity represents a highly-selective anticancer strategy that specifically targets cancer cells without significantly affecting normal tissues.
Copyright © 2012 Elsevier Inc. All rights reserved.
Figures
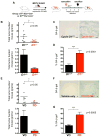
Figure 1. Acute Ablation of Cyclin D1 Blocks Tumor Progression and Triggers Senescence in _ErbB2_-driven Tumors
(A) Schematic representation of the experimental design. (B) Total tumor burden per mouse in cyclin D1F/+/Esr1-Cre/MMTV-ErbB2 (D1Δ/+) and in D1F/−/Esr1-Cre/MMTV-ErbB2 (D1Δ/−) mice. Deletion of cyclin D1 was induced (by tamoxifen administration) upon detection of palpable tumors; mice were sacrificed after 6 weeks. In the top panel, each dot represents the total tumor burden (grams) for a given mouse upon sacrifice, horizontal lines represent mean values. Lower panel: mean total tumor burden (grams) per mouse, error bars, SD, n=10. (C) Representative SA-β-galactosidase staining of sections of _ErbB2_-driven mammary tumors following acute cyclin D1 shutdown (cyclin D1Δ/−), or in control animals (cyclin D1Δ/+). Scale bar represents 50 μm. (D) Mean percentage of SA-β-galactosidase-positive area in tumor sections. For each section, three independent areas were scanned and quantified using software from Aperio Technologies. Error bars, SEM. (E) Total tumor burden per animal in MMTV-ErbB2 mice treated daily with vehicle only (VO) or PD 0332991 (PD, 150 mg/kg body weight) for 6 weeks after detection of palpable tumors. Upper panel shows tumor burden for each mouse, lower panel shows mean values ± SD, n=7. (F) Representative SA-β-galactosidase staining of sections of _ErbB2_-driven mammary carcinomas from mice treated with vehicle only or PD 0332991 for 6 weeks after detection of palpable tumors. Scale bar represents 50 μm. (G) Percentage of area staining positive for SA-β-galactosidase, analyzed as in (D). Error bars, SEM. See also Figure S1.
Figure 2. Acute Ablation of Cyclin D3 in Mouse Model of _Notch1-ICD_-driven T-cell Acute Lymphoblastic Leukemia
(A) Schematic representation of the experimental design. After T-ALL formation in the recipient mice, cyclin D3 ablation was induced at two weeks post BMT. (B) Representative FACS profiles showing percentage of Notch1-ICD-overexpressing GFP+ cells in peripheral blood right after completion of pI-pC administration (started 2 weeks post BMT) to cyclin D3F/F/Mx1-Cre+(_D3_Δ/Δ) or D3F/F/Mx1-Cre− (D3F/F) mice. SSC, side scatter. (C) Mean percentages of GFP+ cells in peripheral blood in mice treated as in (B). Error bars, SD, n=7 (D) Kaplan-Meier analysis of survival time in each group, n=7. See also Figure S2.
Figure 3. Cyclin D3 Is Required for Maintenance of _Notch1-ICD_-driven T-ALL In Vivo
(A) Schematic representation of the experimental design. After T-ALL formation in the recipient mice, cyclin D3 ablation was induced at six and a half weeks post BMT. (B) Representative FACS analysis showing percentage of Notch1-ICD-overexpressing GFP+ cells in spleens right after completion of pI-pC administration (started 6.5 weeks post BMT) in cyclin D3F/F/Mx1-Cre+ (_D3_Δ/Δ) or D3F/F/Mx1-Cre− (D3F/F) mice. SSC, side scatter. (C) Mean percentages of GFP+ cells in spleens in mice treated as in (B). Error bars, SD, n=4. (D) Kaplan-Meier analysis of survival time in each group, n=6. See also Figure S3.
Figure 4. Cyclin D3 Ablation Triggers Apoptosis of _Notch1-ICD_-driven T-ALL Cells
(A–E) Mice received _Notch1-ICD_-GFP-transduced cyclin D3F/F/Mx1-Cre+ (_D3_Δ/Δ) or D3F/F/Mx1-Cre− (D3F/F) bone marrow cells, and were treated five times with pI-pC, starting at 6.5 weeks following BMT. (A) Representative FACS profiles of peripheral blood stained for Annexin V/7-AAD and gated on GFP+ cells. (B) Mean percentages of apoptotic (Annexin V+) cells from peripheral blood (gated on GFP+ cells) and analyzed as in (A). Error bars, SD, n=4. (C) Representative FACS profiles of cells from the spleen stained for Annexin V/7-AAD and gated on GFP+. (D) Mean percentages of apoptotic (Annexin V+) cells from spleens (gated on GFP+ cells) and analyzed as in (C). Error bars, SD, n=4. (E) TUNEL staining of spleen sections. Scale bar represents 50 μm. See also Figure S4.
Figure 5. Pharmacological Inhibition of Cdk4/6 Activity in _Notch1-ICD_-driven T-ALL
(A to F) Mice received _Notch1-ICD_-GFP-transduced C57BL/6 wild-type bone marrow cells, and were fed daily with either vehicle only (VO) or CDK4/6 inhibitor, PD 0332991 (PD, 100–150mg/kg body weight). (A) PD 0332991 treatment was started at 6.5 weeks post bone marrow transplantation. Shown are representative FACS profiles depicting percentage of GFP+ cells in peripheral blood after 7 days of PD 0332991 administration. SSC, side scatter. (B) Mean percentages of GFP+ cells in peripheral blood, in mice treated as in (A). Error bars, SD, n=7. (C and D) Kaplan-Meyer survival curves. In (C), treatment was started at 2 weeks post-BMT (following detection of GFP+ cells in peripheral blood), n = 10 mice per group. In (D) treatment started at 6.5 weeks post-BMT, after animals had developed tumors, n=10 mice per group. (E and F) Splenocytes from vehicle-treated moribund mice were cultured in vitro and treated with vehicle only (VO) or 1uM of PD 0332991 (PD) for 4 days. Cells were then stained for Annexin V/7-AAD, and analyzed by FACS. (E) Shown is a representative FACS profile of Annexin V/7-AAD staining gated on GFP+ splenic tumor cells. (F) Mean percentage of apoptotic (Annexin V+) tumor cells following treatment with vehicle only or 1uM of PD. Error bars, SD, n=4.
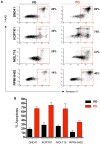
Figure 6. Pharmacological Inhibition of CDK4/6 Kinase Triggers Apoptosis of Human T-ALL Cell Lines
(A and B) Human T-ALL cell lines were cultured and treated with vehicle only (VO) or 1uM of PD 0332991 (PD) for 4 days, stained for Annexin V/7-AAD and analyzed by FACS. (A) Shown are representative FACS profiles of KOPTK1, DND41, MOLT-16 and RPMI-8402 cells stained with Annexin V/7-AAD. (B) Quantification of the apoptotic (Annexin V+) cells, analyzed as above. Shown are mean values. Error bars, SD, n=4. See also Figure S5.
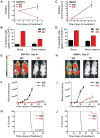
Figure 7. Effects of Pharmacological Inhibition of CDK4/6 on Human T-ALL In Vivo
(A–J) Human KOPTK1-Luc+ or DND41-Luc+ cells were engrafted by tail vein injection into NSG mice and treated daily with vehicle only (VO) or PD 0332991 (PD, 150mg/kg body weight). (A) Animals with established KOPTK1-Luc+ leukemia were treated daily, for 5 days, with vehicle or PD 0332991. Tumor burden is expressed as relative bioluminescence, normalized to the baseline bioluminescence on treatment day 1. Shown are mean values, error bars, SEM. (B) After 5 days of treatment, peripheral blood and bone marrow were collected from KOPTK1-Luc+ xenografted animals, and apoptosis of human leukemic cells determined by FACS analysis of Annexin V/7-AAD staining, gated on human CD45+ cells. Graphs represent mean percentages of apoptotic (Annexin V+) cells. Error bars, SD. (C) Animals with established DND41-Luc+ leukemia were treated daily, for 7 days, with vehicle or PD 0332991. Tumor burden is expressed as relative bioluminescence, normalized to the baseline bioluminescence on treatment day 1. Shown are mean values, error bars, SEM. (D) After 7 days of treatment, peripheral blood and bone marrow were collected from DND41-Luc+ xenografted animals, and apoptosis of human leukemic cells determined by FACS analysis of Annexin V/7-AAD staining, gated on human CD45+ cells. Graphs represent mean percentages of apoptotic (Annexin V+) cells. Error bars, SD. (E) Bioluminescence imaging of representative vehicle- and PD 0332991-treated KOPTK1-Luc+ xenografted animals. (F) Total body bioluminescence (photons s−1 ROI−1) in vehicle- and PD 0332991-treated recipients of KOPTK1-Luc+ cells was monitored over time to determine tumor burden. Shown are mean values, error bars, SEM. (G) Kaplan-Meier survival curves of KOPTK1-Luc+ recipients treated with vehicle or PD 0332991. (H) Bioluminescence imaging of representative vehicle- and PD 0332991-treated DND41-Luc+ xenografted animals. (I) Total body bioluminescence (photons s−1 ROI−1) in vehicle- and PD 0332991-treated recipients of DND41-Luc+ cells was monitored over time to determine tumor burden. Shown are mean values, error bars, SEM. (J) Kaplan-Meier survival curves of DND41-Luc+ recipients treated with vehicle only or PD 0332991. n=8 for all groups. See also Figure S6.
Figure 8. Response of KOPTK1 T-ALL Cells and V720 Breast Cancer Cells to Inhibition of Cyclin D-CDK Kinase
(A) KOPTK1 and V720 cells were treated with PD 0332991 (PD) or vehicle (VO) for 48 hrs and 24 hrs, respectively. Experiment was done in triplicate. Genes which show changes in expression levels after PD treatment were selected based on an absolute fold-change >1.5, absolute mean difference >50 and p-value <0.05, and were classified into three groups: genes with altered expression levels in both cell types (Group 1), in KOPTK1 cells only (Group 2) or in V720 cells only (Group 3). Each row corresponds to one gene and is normalized across the row. (B) Heatmap images representing relative expression levels of cell cycle-related genes that showed significant expression change after PD treatment in KOPTK1 cells (top) or V720 cells (bottom). (C) A heatmap image representing relative expression levels of apoptosis-related genes that showed significant expression change after PD treatment in KOPTK1 cells. (D) Expression levels of seven apoptosis-related genes in KOPTK1 cells. Shown are mean values ± SD, n=3 per group. See also Table S1–S4.
Comment in
- Cell cycle-based therapies move forward.
Malumbres M. Malumbres M. Cancer Cell. 2012 Oct 16;22(4):419-20. doi: 10.1016/j.ccr.2012.09.024. Cancer Cell. 2012. PMID: 23079651
Similar articles
- Therapeutic targeting of the cyclin D3:CDK4/6 complex in T cell leukemia.
Sawai CM, Freund J, Oh P, Ndiaye-Lobry D, Bretz JC, Strikoudis A, Genesca L, Trimarchi T, Kelliher MA, Clark M, Soulier J, Chen-Kiang S, Aifantis I. Sawai CM, et al. Cancer Cell. 2012 Oct 16;22(4):452-65. doi: 10.1016/j.ccr.2012.09.016. Cancer Cell. 2012. PMID: 23079656 Free PMC article. - The metabolic function of cyclin D3-CDK6 kinase in cancer cell survival.
Wang H, Nicolay BN, Chick JM, Gao X, Geng Y, Ren H, Gao H, Yang G, Williams JA, Suski JM, Keibler MA, Sicinska E, Gerdemann U, Haining WN, Roberts TM, Polyak K, Gygi SP, Dyson NJ, Sicinski P. Wang H, et al. Nature. 2017 Jun 15;546(7658):426-430. doi: 10.1038/nature22797. Epub 2017 Jun 7. Nature. 2017. PMID: 28607489 Free PMC article. - Cyclin D-CDK4/6 functions in cancer.
Gao X, Leone GW, Wang H. Gao X, et al. Adv Cancer Res. 2020;148:147-169. doi: 10.1016/bs.acr.2020.02.002. Epub 2020 Apr 2. Adv Cancer Res. 2020. PMID: 32723562 Review. - CDK6-mediated repression of CD25 is required for induction and maintenance of Notch1-induced T-cell acute lymphoblastic leukemia.
Jena N, Sheng J, Hu JK, Li W, Zhou W, Lee G, Tsichlis N, Pathak A, Brown N, Deshpande A, Luo C, Hu GF, Hinds PW, Van Etten RA, Hu MG. Jena N, et al. Leukemia. 2016 May;30(5):1033-43. doi: 10.1038/leu.2015.353. Epub 2015 Dec 28. Leukemia. 2016. PMID: 26707936 Free PMC article. - Cell cycle progression without cyclin D-CDK4 and cyclin D-CDK6 complexes.
Kozar K, Sicinski P. Kozar K, et al. Cell Cycle. 2005 Mar;4(3):388-91. doi: 10.4161/cc.4.3.1551. Epub 2005 Mar 18. Cell Cycle. 2005. PMID: 15738651 Review.
Cited by
- Bridged Proteolysis Targeting Chimera (PROTAC) Enables Degradation of Undruggable Targets.
Xiong Y, Zhong Y, Yim H, Yang X, Park KS, Xie L, Poulikakos PI, Han X, Xiong Y, Chen X, Liu J, Jin J. Xiong Y, et al. J Am Chem Soc. 2022 Dec 14;144(49):22622-22632. doi: 10.1021/jacs.2c09255. Epub 2022 Nov 30. J Am Chem Soc. 2022. PMID: 36448571 Free PMC article. - Selective Pro-Apoptotic Activity of Novel 3,3'-(Aryl/Alkyl-Methylene)Bis(2-Hydroxynaphthalene-1,4-Dione) Derivatives on Human Cancer Cells via the Induction Reactive Oxygen Species.
Sadhukhan P, Saha S, Sinha K, Brahmachari G, Sil PC. Sadhukhan P, et al. PLoS One. 2016 Jul 5;11(7):e0158694. doi: 10.1371/journal.pone.0158694. eCollection 2016. PLoS One. 2016. PMID: 27380262 Free PMC article. - INX-315, a Selective CDK2 Inhibitor, Induces Cell Cycle Arrest and Senescence in Solid Tumors.
Dietrich C, Trub A, Ahn A, Taylor M, Ambani K, Chan KT, Lu KH, Mahendra CA, Blyth C, Coulson R, Ramm S, Watt AC, Matsa SK, Bisi J, Strum J, Roberts P, Goel S. Dietrich C, et al. Cancer Discov. 2024 Mar 1;14(3):446-467. doi: 10.1158/2159-8290.CD-23-0954. Cancer Discov. 2024. PMID: 38047585 Free PMC article. - On-treatment derived neutrophil-to-lymphocyte ratio and survival with palbociclib and endocrine treatment: analysis of a multicenter retrospective cohort and the PALOMA-2/3 study with immune correlates.
Kim CG, Kim MH, Kim JH, Kim SG, Kim GM, Kim TY, Ryu WJ, Kim JY, Park HS, Park S, Cho YU, Park BW, Kim SI, Jeong J, Sohn J. Kim CG, et al. Breast Cancer Res. 2023 Jan 12;25(1):4. doi: 10.1186/s13058-022-01601-4. Breast Cancer Res. 2023. PMID: 36635767 Free PMC article. - Cyclin-Dependent Kinase 4/6 Inhibitors: A Potential Breakthrough Therapy for Malignancies of Gastrointestinal Tract.
Zeng F, Zhou Y, Khowtanapanich T, Saengboonmee C. Zeng F, et al. In Vivo. 2022 Jul-Aug;36(4):1580-1590. doi: 10.21873/invivo.12868. In Vivo. 2022. PMID: 35738597 Free PMC article. Review.
References
- Bowe DB, Kenney NJ, Adereth Y, Maroulakou IG. Suppression of Neu-induced mammary tumor growth in cyclin D1 deficient mice is compensated for by cyclin E. Oncogene. 2002;21:291–298. - PubMed
- Burns KH, Agno JE, Sicinski P, Matzuk MM. Cyclin D2 and p27 are tissue-specific regulators of tumorigenesis in inhibin alpha knockout mice. Mol Endocrinol. 2003;17:2053–2069. - PubMed
- Chaganti RS, Houldsworth J. Genetics and biology of adult human male germ cell tumors. Cancer Res. 2000;60:1475–1482. - PubMed
Publication types
MeSH terms
Substances
Grants and funding
- P01 CA109901/CA/NCI NIH HHS/United States
- P01 CA080111/CA/NCI NIH HHS/United States
- 1K99CA157951/CA/NCI NIH HHS/United States
- K99 CA157951/CA/NCI NIH HHS/United States
- R01 CA083688/CA/NCI NIH HHS/United States
LinkOut - more resources
Full Text Sources
Other Literature Sources
Molecular Biology Databases
Research Materials
Miscellaneous


