Upregulated NLRP3 inflammasome activation in patients with type 2 diabetes - PubMed (original) (raw)
. 2013 Jan;62(1):194-204.
doi: 10.2337/db12-0420. Epub 2012 Oct 18.
Affiliations
- PMID: 23086037
- PMCID: PMC3526026
- DOI: 10.2337/db12-0420
Upregulated NLRP3 inflammasome activation in patients with type 2 diabetes
Hye-Mi Lee et al. Diabetes. 2013 Jan.
Abstract
Despite the recent attention focused on the roles of the nucleotide binding and oligomerization domain-like receptor family pyrin domain-containing 3 (NLRP3) inflammasome in the pathogenesis of type 2 diabetes, little is known about the ex vivo profile of inflammasome activation in type 2 diabetic patients. In this study, we investigated patterns of NLRP3 inflammasome activation in monocyte-derived macrophages (MDMs) from drug-naïve patients with newly diagnosed type 2 diabetes. Type 2 diabetic subjects had significantly increased mRNA and protein expression of NLRP3, apoptosis-associated speck-like protein containing a CARD (ASC), and proinflammatory cytokines in MDMs cultured with autologous sera compared with healthy controls. Upregulated interleukin (IL)-1β maturation, IL-18 secretion, and caspase-1 cleavage were observed in MDMs from type 2 diabetic patients after stimulation with various danger molecules (ATP, high-mobility group protein B1, free fatty acids, islet amyloid polypeptide, and monosodium uric acid crystals). Mitochondrial reactive oxygen species and NLRP3 were required for IL-1β synthesis in MDMs. Finally, 2 months of therapy with the antidiabetic drug metformin significantly inhibited the maturation of IL-1β in MDMs from patients with type 2 diabetes through AMP-activated protein kinase (AMPK) activation. Taken together, these data suggest that NLRP3 inflammasome activation is elevated in myeloid cells from type 2 diabetic patients and that antidiabetic treatment with metformin contributes to modulation of inflammasome activation in type 2 diabetes.
Figures
FIG. 1.
Expression profiles of NLRP3, ASC, and inflammatory cytokines in MDMs and sera from patients with type 2 diabetes (T2D) and healthy controls (HCs). A, C–E: MDMs were obtained from 47 patients with T2D and 57 HCs. The MDMs were incubated with media containing autologous sera and stimulated with ultrapure LPS (A, C, and E; 10 ng/mL) and Pam3CSK4 (Pam, E; 10 ng/mL) for 4 h. B: MDMs were cultured from T2D patients (n = 10) and HCs (n = 10). The protein levels of NLRP3 and ASC were measured by Western blot analysis. The intensity of each band for each protein was quantified and normalized relative to the housekeeping gene β-actin (B, right). D: Sera collected from the peripheral blood of T2D patients (n = 47) and HCs (n = 57). The mRNA expression of Il1β, Nlrp3, and Asc (A) and Il6, Il8, Tnfα, and Ccl2 (E) was analyzed by quantitative real-time RT-PCR. IL-1β and IL-18 production in culture supernatants (C) and sera (D) were measured by ELISA. Serum cytokine levels were determined in samples pretreated with protease inhibitors (4% volume/volume). A and E: Results are expressed as the mean concentration of triplicate samples. Data are representative of two independent experiments. B_–_D: Data are expressed as means ± SEM. *P < 0.05, **P < 0.01, ***P < 0.001 vs. HCs. U, untreated.
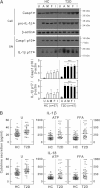
FIG. 2.
Upregulated activation of casapse-1, IL-1β maturation, and production of IL-1β and IL-18 in MDMs from patients with type 2 diabetes (T2D) compared with healthy controls (HCs). MDMs were isolated from T2D patients (n = 47) and HCs (n = 57) were primed with LPS (10 ng/mL) for 4 h and stimulated with various ligands: ATP (1 mmol/L for 1 h), MSU (100 μg/mL for 6 h), FFAs (200 μmol/L for 16 h), and IAPP (10 μmol/L for 16 h). A: Western blotting analysis to determine caspase-1 (Casp1) and IL-1β protein levels (cell lysates [Cell], Casp1 p45, and pro-IL-1β [31 kDa]; supernatants [SN], cleaved Casp1 p10, and mature IL-1β [17 kDa]). The intensity of each band for each protein was quantified and normalized to the housekeeping gene β-actin (A, bottom). Data are expressed as means ± SEM. B: ELISA of IL-1β (top) and IL-18 (bottom) levels in culture supernatants. Cells were left untreated (U; left) or treated with the indicated ligands. Results are expressed as the mean of triplicate samples. Data are representative of two independent experiments. ***P < 0.001 vs. HCs. A, ATP; M, MSU; F, FFAs; I, IAPP.
FIG. 3.
Upregulated NLRP3 inflammasome activation in patients with type 2 diabetes (T2D) is mediated by mitochondrial ROS. A: PBMCs isolated from T2D patients (n = 9) and healthy controls (HCs; n = 9) were primed with LPS (10 ng/mL) for 4 h and then stimulated with ATP (1 mmol/L) or HMGB1 (10 ng/mL) for 1 h in the absence or presence of Mito-TEMPO (mit; 200 μmol/L). Then, the cells were stained with MitoSOX, gated for the CD14+ population, and analyzed by flow cytometry. Representative images (left) and quantitative analysis of mean fluorescence intensities (right) are shown (A, right). Data are expressed as means ± SEM. B: MDMs from T2D patients (n = 5) and HCs (n = 5) were primed with LPS (10 ng/mL, for 4 h), and then stimulated with ATP (1 mmol/L) or HMGB1 (10 ng/mL) for 1 h in the absence or presence of Mito-TEMPO (mit; 200 μmol/L). C: MDMs from T2D patients (n = 5) and HCs (n = 5) were transduced with nonspecific control shRNA lentiviral particles (shNS) or lentiviral shRNA specific for NLRP3 (shNLRP3) or ASC (shASC), primed with LPS, and stimulated with ATP (1 mmol/L for 1 h) or MSU (100 μg/mL for 6 h). ELISA analysis of IL-1β (B and C) and IL-18 (B). Data are expressed as means ± SEM. C: Representative images of gels run to assess transduction efficiency by semiquantitative RT-PCR analysis (top). ***P < 0.001 vs. HCs. U, untreated; A, ATP; M, MSU; SC, solvent control.
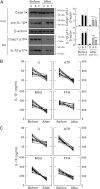
FIG. 4.
Metformin treatment inhibits the secretion of mature IL-1β and caspase-1 activation in MDMs from patients with type 2 diabetes (T2D). MDMs were isolated from T2D patients (n = 11) before (Before) and after (After) treatment with metformin for 2 months. MDMs were primed with LPS (10 ng/mL) for 4 h, and then stimulated with various ligands: ATP (1 mmol/L for 1 h), MSU (100 μg/mL for 6 h), and FFAs (200 μmol/L for 16 h). A: Western blotting analysis to determine caspase-1 (Casp1) and IL-1β protein levels (cell lysates [Cell], Casp1 p45, and pro-IL-1β [31 kDa]; supernatants [SN], cleaved Casp1 p10, and mature IL-1β [17 kDa]) (A, right). The intensity of each band for each protein was quantified and normalized to the housekeeping gene β-actin. Data are expressed as means ± SEM. ***P < 0.001 vs. control cultures. ELISA analysis of IL-1β (B) and IL-18 (C) levels in supernatants from cultured MDMs. Results are expressed as the mean of triplicate samples. Data are representative of two independent experiments. U, untreated; A, ATP; M, MSU; F, FFAs.
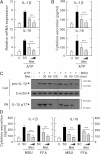
FIG. 5.
The antidiabetic drug metformin inhibits IL-1β and IL-18 production induced by various inflammasome stimuli in LPS-primed MDMs. Primary MDMs from healthy controls (n = 5) were primed with LPS (10 ng/mL for 4 h) in the presence of a high glucose concentration (15 mmol/L). They were then treated with metformin (Met) at the indicated doses (A, B, and D; 200 and 500 μmol/L for 60 min) or for the indicated periods of time (C; 200 μmol/L for 30, 60, or 120 min), and stimulated with ATP (A_–_C; 1 mmol/L for 1 h), MSU (C and D; 100 μg/mL for 6 h), or FFAs (D; 200 μmol/L for 16 h). A: Quantitative real-time RT-PCR analysis of Il1β and IL8 mRNA levels. B and D: ELISA analysis of IL-1β and IL-18. C: Western blotting analysis of IL-1β protein levels in cell lysates (Cell, pro-IL-1β [31 kDa]) and supernatants (SN; mature IL-1β [17 kDa]). A, B, and D: Data are expressed as means ± SEM of five independent experiments. ***P < 0.001 vs. solvent control (SC). U, untreated.
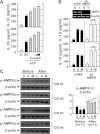
FIG. 6.
AMPK pathway activation inhibits the induction of IL-1β and IL-18 production by various inflammasome stimuli in LPS-primed MDMs. Primary MDMs were isolated from healthy controls (A and B; n = 5) or type 2 diabetic patients (C; n = 11) before and after treatment with metformin for 2 months. A: MDMs were primed with LPS (10 ng/mL) for 4 h in the presence of a high glucose concentration (15 mmol/L) and then treated with compound C (Comp C; 5, 10, or 25 μmol/L) and stimulated with ATP (1 mmol/L for 1 h). Data are expressed as means ± SEM of five independent experiments. B: MDMs were transduced with nonspecific control shRNA lentiviral particles (shNS) or lentiviral shRNA specific for AMPK (shAMPK). Then, the cells were primed with LPS (10 ng/mL) for 4 h in the presence of a high glucose concentration (15 mmol/L) and treated with ATP or MSU (100 μg/mL for 6 h). Data are expressed as means ± SEM of three independent experiments. Representative images of semiquantitative RT-PCR gels run to assess transduction efficiency (top). C: The cells were primed with LPS (10 ng/mL) for 4 h in the presence of autologous sera and then treated with ATP or MSU. A and B: ELISA of IL-1β and IL-18 levels. C: Western blotting analysis of p-AMPKα protein levels. The intensity of each band for each protein was quantified and normalized to the housekeeping protein β-actin (C, right). Data are expressed as means ± SEM. ***P < 0.001 vs. control cultures. U, untreated; SC, solvent control; A, ATP; M, MSU; Before, before treatment with metformin; After, after treatment with metformin.
Comment in
- Nlrp3 inflammasome activation in type 2 diabetes: is it clinically relevant?
Dixit VD. Dixit VD. Diabetes. 2013 Jan;62(1):22-4. doi: 10.2337/db12-1115. Diabetes. 2013. PMID: 23258906 Free PMC article. No abstract available.
Similar articles
- Activation of the NLRP3 inflammasome by group B streptococci.
Costa A, Gupta R, Signorino G, Malara A, Cardile F, Biondo C, Midiri A, Galbo R, Trieu-Cuot P, Papasergi S, Teti G, Henneke P, Mancuso G, Golenbock DT, Beninati C. Costa A, et al. J Immunol. 2012 Feb 15;188(4):1953-60. doi: 10.4049/jimmunol.1102543. Epub 2012 Jan 16. J Immunol. 2012. PMID: 22250086 Free PMC article. - Importance of NLRP3 Inflammasome in Abdominal Aortic Aneurysms.
Shi J, Guo J, Li Z, Xu B, Miyata M. Shi J, et al. J Atheroscler Thromb. 2021 May 1;28(5):454-466. doi: 10.5551/jat.RV17048. Epub 2021 Mar 6. J Atheroscler Thromb. 2021. PMID: 33678767 Free PMC article. Review. - The Role of NLRP3 Inflammasome in Diabetic Cardiomyopathy and Its Therapeutic Implications.
Ding K, Song C, Hu H, Yin K, Huang H, Tang H. Ding K, et al. Oxid Med Cell Longev. 2022 Sep 6;2022:3790721. doi: 10.1155/2022/3790721. eCollection 2022. Oxid Med Cell Longev. 2022. PMID: 36111168 Free PMC article. Review.
Cited by
- Focus on the Role of NLRP3 Inflammasome in Diseases.
Fusco R, Siracusa R, Genovese T, Cuzzocrea S, Di Paola R. Fusco R, et al. Int J Mol Sci. 2020 Jun 13;21(12):4223. doi: 10.3390/ijms21124223. Int J Mol Sci. 2020. PMID: 32545788 Free PMC article. Review. - Reactive oxygen species-induced TXNIP drives fructose-mediated hepatic inflammation and lipid accumulation through NLRP3 inflammasome activation.
Zhang X, Zhang JH, Chen XY, Hu QH, Wang MX, Jin R, Zhang QY, Wang W, Wang R, Kang LL, Li JS, Li M, Pan Y, Huang JJ, Kong LD. Zhang X, et al. Antioxid Redox Signal. 2015 Apr 1;22(10):848-70. doi: 10.1089/ars.2014.5868. Antioxid Redox Signal. 2015. PMID: 25602171 Free PMC article. - Potential Impact of Bioactive Compounds as NLRP3 Inflammasome Inhibitors: An Update.
Singh S, Sharma S, Sharma H. Singh S, et al. Curr Pharm Biotechnol. 2024;25(13):1719-1746. doi: 10.2174/0113892010276859231125165251. Curr Pharm Biotechnol. 2024. PMID: 38173061 Review. - Heat shock response during the resolution of inflammation and its progressive suppression in chronic-degenerative inflammatory diseases.
Schroeder HT, De Lemos Muller CH, Heck TG, Krause M, Homem de Bittencourt PI. Schroeder HT, et al. Cell Stress Chaperones. 2024 Feb;29(1):116-142. doi: 10.1016/j.cstres.2024.01.002. Epub 2024 Jan 19. Cell Stress Chaperones. 2024. PMID: 38244765 Free PMC article. Review. - Potential Mechanisms and Effects of Chinese Medicines in Treatment of Diabetic Atherosclerosis by Modulating NLRP3 Inflammasome: A Narrative Review.
Yuan JY, Fu Y, Feng ZH, Sang F, Shao MY, Li LL. Yuan JY, et al. Chin J Integr Med. 2022 Aug;28(8):753-761. doi: 10.1007/s11655-022-3513-4. Epub 2022 May 4. Chin J Integr Med. 2022. PMID: 35507299 Review.
References
- Centers for Disease Control and Prevention. National Diabetes Surveillance System: prevalence of diabetes. http://www.cdc.gov/diabetes/statistics/prev/national/menuage.htm 2010
- Donath MY, Shoelson SE. Type 2 diabetes as an inflammatory disease. Nat Rev Immunol 2011;11:98–107 - PubMed
- Ceriello A, Motz E. Is oxidative stress the pathogenic mechanism underlying insulin resistance, diabetes, and cardiovascular disease? The common soil hypothesis revisited. Arterioscler Thromb Vasc Biol 2004;24:816–823 - PubMed
- Zhou R, Tardivel A, Thorens B, Choi I, Tschopp J. Thioredoxin-interacting protein links oxidative stress to inflammasome activation. Nat Immunol 2010;11:136–140 - PubMed
Publication types
MeSH terms
Substances
LinkOut - more resources
Full Text Sources
Other Literature Sources
Medical
Miscellaneous


