Nuclear pore component Nup98 is a potential tumor suppressor and regulates posttranscriptional expression of select p53 target genes - PubMed (original) (raw)
. 2012 Dec 14;48(5):799-810.
doi: 10.1016/j.molcel.2012.09.020. Epub 2012 Oct 24.
Ruiying Zhao, Anthony M Barsotti, Anette Ouwehand, Mina Fazollahi, Elias Coutavas, Kai Breuhahn, Olaf Neumann, Thomas Longerich, Tobias Pusterla, Maureen A Powers, Keith M Giles, Peter J Leedman, Jochen Hess, David Grunwald, Harmen J Bussemaker, Robert H Singer, Peter Schirmacher, Carol Prives
Affiliations
- PMID: 23102701
- PMCID: PMC3525737
- DOI: 10.1016/j.molcel.2012.09.020
Nuclear pore component Nup98 is a potential tumor suppressor and regulates posttranscriptional expression of select p53 target genes
Stephan Singer et al. Mol Cell. 2012.
Abstract
The p53 tumor suppressor utilizes multiple mechanisms to selectively regulate its myriad target genes, which in turn mediate diverse cellular processes. Here, using conventional and single-molecule mRNA analyses, we demonstrate that the nucleoporin Nup98 is required for full expression of p21, a key effector of the p53 pathway, but not several other p53 target genes. Nup98 regulates p21 mRNA levels by a posttranscriptional mechanism in which a complex containing Nup98 and the p21 mRNA 3'UTR protects p21 mRNA from degradation by the exosome. An in silico approach revealed another p53 target (14-3-3σ) to be similarly regulated by Nup98. The expression of Nup98 is reduced in murine and human hepatocellular carcinomas (HCCs) and correlates with p21 expression in HCC patients. Our study elucidates a previously unrecognized function of wild-type Nup98 in regulating select p53 target genes that is distinct from the well-characterized oncogenic properties of Nup98 fusion proteins.
Copyright © 2012 Elsevier Inc. All rights reserved.
Figures
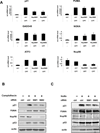
Figure 1. Nup98 Depletion Selectively Reduces p21 mRNA and Protein Accumulation upon p53 Activation
(A) HepG2 cells were treated either with control (ctrl) or two Nup98 siRNAs (Nup9898#1 and Nup9898#2) for 72 h and CPT (300 nM) was added for the final 24 h before lysis of cells for mRNA and protein analysis. Relative expression of p53 target genes: p21, PUMA, GADD45, NOXA, ATF3 and Nup98 was measured by qRT-PCR and normalized to 1 for each ctrl siRNA and drug treatment condition. Data are presented as mean ± standard deviation (SD) of three independent experiments. (B) HepG2 cell were treated as in (A) and cell extracts were examined by immunoblotting with indicated antibodies. (C) HepG2 cells were treated either with control (ctrl) or Nup9898#1 and Nup9898#2 siRNA for 72 h and Nutlin-3 (20 µM) was added 24 h prior to extraction of cells for protein analysis. Cell extracts were analyzed by immunoblotting with the indicated antibodies.
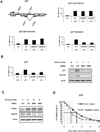
Figure 2. Post-transcriptional Regulation of p21 by Nup98
(A) Nup98 regulates the levels of mature but not nascent p21 mRNA. Upper left panel: schematic depicts primers used to amplify different regions of nascent and mature p21 mRNA. The numbers indicate the position of the amplicon within the p21 gene locus. Rectangles represent exons 1 to 3. HepG2 cells were treated as described in Figure 1A. Nascent p21 mRNA induction was measured by qRT-PCR with primer pairs annealing to intronic regions of the unspliced transcript: first intron (+4001) (upper right panel) and second intron (+7011) (lower left panel), respectively. Lower right panel: spliced p21 mRNA was measured by using the exon-spanning primer pair (+5817/+7223) indicated in the schematic. Data are presented as mean ± SD of two independent (experiments. (B) Nup98 regulates exogenous p21 mRNA. Left panel: H24-p21 cells containing a tetracycline (Tet-off)-regulatable p21 expression construct were treated either with control (ctrl) or Nup98 siRNAs (Nup9898#1 and Nup9898#2) for 72 h. as in Figure 1. p21 was induced by removal of Tet 24 h before harvesting. Left panel shows relative p21 and Nup98 mRNA expression measured by qRT-PCR and normalized to 1 for the “ctrl siRNA tet-“ condition. Data are presented as mean ± SD derived from two independent experiments. Right panel: protein expression from the same experimental condition analyzed by immunoblotting with indicated antibodies. (C) PUMA levels are not affected by Nup98 knock-down H1299-derivative cell line containing a tetracycline (Tet-on)-regulatable PUMA expression construct (H24-PUMA) was treated either with control (ctrl) or two Nup98 siRNAs (Nup9898#1 and Nup9898#2) for 72 h. PUMA was induced by adding Doxycycline 24 h before harvesting. Cell extracts were analyzed by immunoblotting with indicated antibodies. (D) Nup98 stabilizes mature p21 mRNA HepG2 cells were treated either with control (ctrl) or Nup9898#2 siRNA (Nup9898#2) for 72 h and Nutlin-3 (20 µM) was added 24 h before blocking mRNA synthesis with 0.4 µM Actinomycin-D (Act-D). Cells were harvested at indicated time points and mature p21 mRNA decay was measured by qRT-PCR with the exon-spanning primer pairs described in Figure 2A. The solid and dotted lines indicate the half-life of p21 in ctrl-siRNA or Nup9898#2 conditions, respectively.
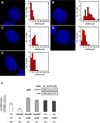
Figure 3. Nup98 Affects Nuclear and Cytoplasmic p21 mRNA level and Protects p21 mRNA from Degradation by the Exosome
Nup98 knock-down affects the levels of nuclear and cytoplasmic p21 mRNA. (A-E). Left panels show images of HepG2 cells that were treated either with ctrl (A,B) or Nup9898#1 (C) Nup9898#3 (D) or p21 (E) siRNAs for 72 h and then treated with either DMSO (A) or Nutlin-3 (20 µM; B,C,D and E) for 24 h prior to single-mRNA FISH analysis as described in Methods. FISH images were detected in the Cy5 channels and color-coded as red. The blue channel contains a DAPI stain to demarcate the nuclei. For display 5 to 15 images, depending on cell shape, from the cell mid-section were averaged in both channels. Scale bar shown in panel E equals 2 µm in all images. Right panels are histograms of p21 mRNA molecule counts per cell corresponding to panels A (48 cells counted); B (58 cells counted), C (29 cells counted) D (55 cells counted) and E (59 cells counted). Data are pooled from three repeats of the experiments with errors and statistical analysis shown in Table S1. (F) Exosc3 knockdown rescues lowered p21 mRNA levels upon Nup98 depletion. H24 p21 tet-off cells were treated individually with either control (ctrl) or Nup9898#1 siRNA, or co-transfected with Exosc3 siRNA (Ex398#1 and Ex398#2) for 72 h as indicated. p21 was induced by removal of Tet 48 h before harvesting. Relative p21 mRNA levels were measured with qRT-PCR. Data are presented as mean ± SD (left panel). Western blot (inset) shows Exosc3 levels in p21 H24 cells treated either with ctrl or Ex398#1 and Ex398#2 siRNA. Actin serves as loading control.
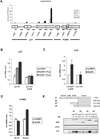
Figure 4. The 3’-UTR of p21 mRNA Co-associates with Nup98 and Is Required for Nup98 Mediated Increased Levels of p21 mRNA
(A) Nup98 associates with the 3’-UTR of p21. RNA-IP was performed as described in Methods. Briefly, Nup98 was immunoprecipitated from 0.1% formaldehyde cross-linked samples of CPT (300 nM for 24 h) treated or untreated HepG2 cells. Co-immunoprecipitated mRNAs cross-linked to Nup98 were reverse-transcribed and amplified by qRT-PCR. Primer pairs specific for different regions of p21 mRNA or PUMA mRNA were used. In the schematic below the graph rectangles represent exonic regions of the respective genes and shaded rectangles indicate the 3’-UTRs of p21 and PUMA mRNA as indicated. The numbers below the lines indicate the position of each amplicon within the p21 or PUMA gene locus, respectively. Data are presented as mean ± SD. (B) The 3’-UTR of p21 mRNA is required for increased p21 expression levels mediated by ectopically expressed Nup98. Hep3B cells were co-transfected with HA-tagged Nup98 (0.75 or 1.25 µg) and p21 cDNA containing the 3’-UTR (p21 FL, 200 ng) or p21 cDNA without the 3’-UTR (p21 del 3’-UTR, 20ng) 24h prior to RNA extraction. p21 mRNA levels transcribed from the respective constructs were measured with qRT-PCR. Data are presented as mean ± SD. (C) The 3’-UTR of p21mRNA is sufficient for stabilization by Nup98. H1299 cells were co-transfected with HA-tagged Nup98 (1.75 µg) and a Luciferase construct (Luc/p21 3’UTR, 200 ng) containing the 3’UTR of p21 mRNA or the Luciferase construct lacking the p21 mRNA 3’UTR (Luc ctrl, 20ng) 48 h prior to RNA extraction. The mRNA levels transcribed from the respective constructs were measured with qRT-PCR. Data are presented as mean ± SD of two independent experiments. (D) The 3’-UTR of p21mRNA is sufficient for stabilization by Nup98. H1299 cells were co-transfected with HA-tagged Nup98 (1.75 µg) and a construct containing the coding DNA sequence (CDS) and the 3’UTR of PUMA (Pu FL, 200ng) or a hybrid construct containing the PUMA CDS fused to the 3’UTR of p21 (Pu/p21, 200ng) The mRNA levels transcribed from the respective constructs were measured with qRT-PCR. Data are presented as mean ± SD. (E) The GLFG repeat domain of Nup98 is required for maximal increase of p21 expression H1299 cells were co-transfected with GFP tagged full length (98#1) or truncated (98#2–4) Nup98 constructs with indicated concentrations and 1 µg untagged full length p21 cDNA 24 h before protein extraction. Immunoblot shows protein expression of transfected Nup98 and p21 detected with the indicated antibodies. Actin serves as loading control.
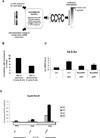
Figure 5. An In Silico Approach Identifies 14-3-3σ as another p53 Target Gene mRNA that Associates with and is Regulated by Nup98
(A) Flow-chart describing the unbiased genomewide in silico cis-regulatory analysis that yielded the CCc/tC motif. The MatrixREDUCE algorithm was used to discover a nucleotide sequence motif (in the form of a weight matrix) whose occurrences in the 3’-UTR optimally predict p53-dependent changes in steady-state mRNA expression 72 h after doxorubicin treatment. (B) Motif occurrences in a 400 bp window immediately upstream of the polyadenylation site are significantly more predictive of the expression changes than those downstream, suggesting that the C-rich motifs represents the specificity of an RNA-binding factor. (C) HepG2 cells were treated either with ctrl or Nup9898#1 and Nup9898#2 siRNA for 72 h and 300 nM (CPT) was added for the final 24 h before RNA extraction. 14-3-3σ mRNA was measured by qRT-PCR. The ctrl siRNA and no CPT condition was taken as 1. Data are presented as mean ± SD of two independent experiments. (D) RNA-IP experiment in HepG2 cells was performed as in Figure 4A. Primer pairs specific for different regions of 14-3-3σ mRNA were used to localize the potential regions of interaction with Nup98. The rectangle represents the single 14-3-3σ exon and the shaded area indicates the 3’-UTR. The numbers indicate the position of each amplicon within the 14-3-3σ gene locus. Data are presented as mean ± SD.
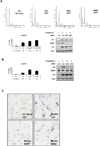
Figure 6. Nup98 Depletion Increases Camptothecin (CPT) Induced Cell Death and Decreases Nutlin Induced Senescence
(A) Nup98 knock-down sensitizes cells to CPT induced apoptosis. Upper panels: FACS analysis was performed with propidium iodide stained samples of HepG2 cells following transfection with control (ctrl) or Nup98 (9898#1 and 9898#2) siRNAs and drug treatment as described in Figure 1A. Data was analyzed using the ModFit program. Lower left panel: bar diagram shows relative % of subG1 cells taken as a measurement of cell death for each indicated condition. Data are presented as mean ± SD derived from two independent experiments. Lower right panel: protein levels in HepG2 cells treated as above were analyzed by immunoblotting with indicated antibodies. (B) p21 knockdown recapitulates the effects of Nup98 knockdown in CPT treated cells. Left panel: FACS analysis was performed in HepG2 cells as described in (A) following transfection with p21 siRNA (2198#1 and 2198#2) and drug treatment. Bar diagram shows relative percentage (%) of subG1 cells as a measurement of cell death for each indicated condition. Data are presented as mean ± SD derived from two independent experiments. Right panel: protein levels in cells treated as above detected by Western blotting with indicated antibodies. (C) Nup98 knock-down decreases Nutlin induced senescence. Sk-Hep1 cells were treated either with ctrl or Nup9898#1 and Nup9898#2 siRNA for 24h and Nutlin-3 (10 µM) was added as indicated 5 days prior to staining senescence associated β galactosidase (SA- β -Gal). Shown are representative images of cells with SA-β -Gal staining for the indicated conditions.
Figure 7. Nup98 Expression Is Downregulated in Hepatocellular Carcinomas (HCCs) in MDR-2 −/− Mice and in Patients with HCC
(A-B) Lowered hepatocellular Nup98 immunoreactivity in murine tumor tissue compared to non-tumorous tissue. (A) Corresponding representative liver sections of MDR-2 −/− mice (15 months) either stained with H&E (upper left and upper right panel) or immunohistochemically stained with a polyclonal Nup98 antibody (lower left and lower right panel). Non-tumorous (NT) and tumorous (T) liver tissue is shown in the left and right column respectively. Black arrows indicate nuclei of hepatocytes and hepatocellular tumor cells and blue arrows indicate nuclei of sinusoidal cells and inflammatory cells. Scale bar represents 100 µm. (B) Diagram shows median values of semiquantiative hepatocellular Nup98 immunohistochemical staining intensities of non-tumorous (NT) and tumorous (T) liver tissue samples of individual MDR-2 −/− mice. Statistical significance was determined from non-parametric testing (Mann-Whitney-U-test, **p<0.01). (C) Nup98 expression is downregulated in human hepatocellular carcinoma. The relative Nup98 mRNA expression in 27 human hepatocellular carcinoma (HCC) tissue samples (black bars) was assessed by qRT-PCR and compared to the similarly assessed averaged expression (horizontal line) of 2 non-tumorous (NT) liver tissues normalized to 1 (white bars). Red dotted lines indicate thresholds of 2-fold higher or lower expression than the averaged expression in non-tumorous liver tissue. Relative expression in primary hepatocytes (PHH) is also shown (grey bar). 18s-rRNA was used as a housekeeping gene for internal normalization. Data are presented as mean ± SD. (D) Nup98 and p21 expression are correlated in human hepatocellular carcinoma (HCC). Scatterplot depicts relative Nup98 (x-axis) and p21 (y-axis) mRNA levels measured by qRT-PCR in tumors of the same cohort of HCC patients as in (C). Pearson’s correlation coefficient was used as a measure of association.
Comment in
- Shaping the p53 response with nucleoporins.
Yarbrough ML, White MA, Fontoura BM. Yarbrough ML, et al. Mol Cell. 2012 Dec 14;48(5):665-6. doi: 10.1016/j.molcel.2012.11.027. Mol Cell. 2012. PMID: 23244761 Free PMC article.
Similar articles
- Nucleoporin Nup155 is part of the p53 network in liver cancer.
Holzer K, Ori A, Cooke A, Dauch D, Drucker E, Riemenschneider P, Andres-Pons A, DiGuilio AL, Mackmull MT, Baßler J, Roessler S, Breuhahn K, Zender L, Glavy JS, Dombrowski F, Hurt E, Schirmacher P, Beck M, Singer S. Holzer K, et al. Nat Commun. 2019 May 14;10(1):2147. doi: 10.1038/s41467-019-10133-z. Nat Commun. 2019. PMID: 31089132 Free PMC article. - Tumor-suppressor effect of interferon regulatory factor-1 in human hepatocellular carcinoma.
Moriyama Y, Nishiguchi S, Tamori A, Koh N, Yano Y, Kubo S, Hirohashi K, Otani S. Moriyama Y, et al. Clin Cancer Res. 2001 May;7(5):1293-8. Clin Cancer Res. 2001. PMID: 11350897 - The centrosomal protein Tax1 binding protein 2 is a novel tumor suppressor in hepatocellular carcinoma regulated by cyclin-dependent kinase 2.
Lai WL, Hung WY, Wong LL, Zhou Y, Leong VY, Lee JM, Ng IO, Jin DY, Ching YP. Lai WL, et al. Hepatology. 2012 Nov;56(5):1770-81. doi: 10.1002/hep.25851. Epub 2012 Sep 17. Hepatology. 2012. PMID: 22610972 - Targeting the p53-p21 axis in liver cancer: Linking cellular senescence to tumor suppression and progression.
Thangavelu L, Altamimi ASA, Ghaboura N, Babu MA, Roopashree R, Sharma P, Pal P, Choudhary C, Prasad GVS, Sinha A, Balaraman AK, Rawat S. Thangavelu L, et al. Pathol Res Pract. 2024 Nov;263:155652. doi: 10.1016/j.prp.2024.155652. Epub 2024 Oct 15. Pathol Res Pract. 2024. PMID: 39437639 Review. - The p53 target Wig-1: a regulator of mRNA stability and stem cell fate?
Vilborg A, Bersani C, Wilhelm MT, Wiman KG. Vilborg A, et al. Cell Death Differ. 2011 Sep;18(9):1434-40. doi: 10.1038/cdd.2011.20. Epub 2011 Mar 11. Cell Death Differ. 2011. PMID: 21394102 Free PMC article. Review.
Cited by
- POM121 is a novel marker for predicting the prognosis of laryngeal cancer.
Zhao R, Tang G, Wang T, Zhang L, Wang W, Zhao Q, Zhao K. Zhao R, et al. Histol Histopathol. 2020 Nov;35(11):1285-1293. doi: 10.14670/HH-18-267. Epub 2020 Oct 5. Histol Histopathol. 2020. PMID: 33016327 - POM121 promotes the proliferation and metastasis of gastric cancer via PI3K/AKT/MYC pathway.
Kang C, Jia L, Hao L, Zhang N, Liu Y, Zhang L. Kang C, et al. Am J Cancer Res. 2023 Feb 15;13(2):485-497. eCollection 2023. Am J Cancer Res. 2023. PMID: 36895982 Free PMC article. - The Structure of the Nuclear Pore Complex (An Update).
Lin DH, Hoelz A. Lin DH, et al. Annu Rev Biochem. 2019 Jun 20;88:725-783. doi: 10.1146/annurev-biochem-062917-011901. Epub 2019 Mar 18. Annu Rev Biochem. 2019. PMID: 30883195 Free PMC article. Review. - From hypothesis to mechanism: uncovering nuclear pore complex links to gene expression.
Burns LT, Wente SR. Burns LT, et al. Mol Cell Biol. 2014 Jun;34(12):2114-20. doi: 10.1128/MCB.01730-13. Epub 2014 Mar 10. Mol Cell Biol. 2014. PMID: 24615017 Free PMC article. Review. - Post-transcriptional regulation of DNA damage-responsive gene expression.
McKay BC. McKay BC. Antioxid Redox Signal. 2014 Feb 1;20(4):640-54. doi: 10.1089/ars.2013.5523. Epub 2013 Sep 12. Antioxid Redox Signal. 2014. PMID: 23905704 Free PMC article. Review.
References
- Blevins MB, Smith AM, Phillips EM, Powers MA. Complex formation among the RNA export proteins Nup98, Rae1/Gle2, and TAP. J Biol Chem. 2003;278:20979–20988. - PubMed
- Chau BN, Diaz RL, Saunders MA, Cheng C, Chang AN, Warrener P, Bradshaw J, Linsley PS, Cleary MA. Identification of SULF2 as a novel transcriptional target of p53 by use of integrated genomic analyses. Cancer Res. 2009;69:1368–1374. - PubMed
Publication types
MeSH terms
Substances
Grants and funding
- T32 GM082797/GM/NIGMS NIH HHS/United States
- R01 HG003008/HG/NHGRI NIH HHS/United States
- T32GM082797/GM/NIGMS NIH HHS/United States
- U54CA121852/CA/NCI NIH HHS/United States
- R01 CA077742/CA/NCI NIH HHS/United States
- R01HG003008/HG/NHGRI NIH HHS/United States
- U54 CA121852/CA/NCI NIH HHS/United States
- R01 GM086217/GM/NIGMS NIH HHS/United States
- CA77742/CA/NCI NIH HHS/United States
- GM86217/GM/NIGMS NIH HHS/United States
LinkOut - more resources
Full Text Sources
Medical
Molecular Biology Databases
Research Materials
Miscellaneous
