Redirecting cell-type specific cytokine responses with engineered interleukin-4 superkines - PubMed (original) (raw)
doi: 10.1038/nchembio.1096. Epub 2012 Oct 28.
Remi J Creusot, Ignacio Moraga, Darren L Bates, Michael T Wong, Michael N Alonso, Megan M Suhoski, Patrick Lupardus, Martin Meier-Schellersheim, Edgar G Engleman, Paul J Utz, C Garrison Fathman, William E Paul, K Christopher Garcia
Affiliations
- PMID: 23103943
- PMCID: PMC3508151
- DOI: 10.1038/nchembio.1096
Redirecting cell-type specific cytokine responses with engineered interleukin-4 superkines
Ilkka S Junttila et al. Nat Chem Biol. 2012 Dec.
Abstract
Cytokines dimerize their receptors, with the binding of the 'second chain' triggering signaling. In the interleukin (IL)-4 and IL-13 system, different cell types express varying numbers of alternative second receptor chains (γc or IL-13Rα1), forming functionally distinct type I or type II complexes. We manipulated the affinity and specificity of second chain recruitment by human IL-4. A type I receptor-selective IL-4 'superkine' with 3,700-fold higher affinity for γc was three- to ten-fold more potent than wild-type IL-4. Conversely, a variant with high affinity for IL-13Rα1 more potently activated cells expressing the type II receptor and induced differentiation of dendritic cells from monocytes, implicating the type II receptor in this process. Superkines showed signaling advantages on cells with lower second chain numbers. Comparative transcriptional analysis reveals that the superkines induce largely redundant gene expression profiles. Variable second chain numbers can be exploited to redirect cytokines toward distinct cell subsets and elicit new actions, potentially improving the selectivity of cytokine therapy.
Figures
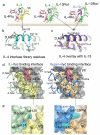
FIGURE 1. Structure-based engineering of IL-4 superkines
(a) Crystal structures of the IL-4 and IL-13 Type-I and Type-II ternary ectodomain complexes . (b) and (c) The principal γc and IL-13Rα1 binding sites on the D-helices of IL-4 and IL-13, respectively. In (b) the positions randomized in the IL-4 site 2 library are shown, and in (c) a structural superposition of IL-4 and IL-13 in the receptor complexes shows that positions 121, 124, and 125 of IL-4 superimpose closely on the analogous positions of IL-13. In (c) IL-13 is in purple, and IL-4 is in light green, substituted residues are in red. (d) Isolated view of the site 2 interfaces in the WT (left) and super-4 (right) complexes with γc. The view shown is the ribbon representation of the A and D helices of the cytokines, with γc-interacting side chains shown, projected onto the semi-transparent molecular surface of γc. The interacting residues of γc underneath the surface are visible as dark outlines on the surface. The area contacted by the respective cytokines on γc is indicated in yellow on the surface, and the energetically critical Tyr103 of γc is colored red. A dashed oval encircles a region of the interface shown from the side in panel (e). In (e) a close-up is shown of interface packing and shape complementarity in super-4 (right) versus IL-4 (left).
FIGURE 2. Effect of IL-4 superkines on intracellular signaling
(a) Overnight starved Ramos cells were unstimulated or stimulated for indicated times with 100 pg/ml of IL-4, super-4 or KFR. The cells were then fixed, permeabilized and stained with antibody against phosphorylated STAT6. (b-e) Ramos cells (b), Ramos cell starved overnight (c), A549 cells (d) and U937 cells (e) were stimulated for 15 minutes with increasing amounts of IL-4, super-4 and KFR, the analysis was then performed as in Figure 3a. (f) Ramos cells were stimulated for 8 hours either with IL-4 or super-4 as indicated, followed by surface staining of CD23. Means and SEMs from three independent experiments are shown for all experiments. (g) Expression of IL-4 Type-I and Type-II receptor chains on human PBLs from five donors. For the measurement of IL-4Rα, γc and IL-13Rα1 expression, B and T cells were gated by cell surface markers (CD19, CD4, CD8), while monocytes were identified as CD14+ cells. Appropriate isotype controls served as negative control. (h) Normalized pSTAT6 EC50 values obtained based on sigmoidal dose-response curves of IL-4 and the superkines (Supplementary Fig.6). pSTAT6 EC50 values from IL-4 wt were normalized to 1 and the EC50 values of the super-4 and KFR were calculated accordingly, means and SD are presented. Paired T-test was used to determine significant changes. In all the experiments, asterisk represent significant p values (p<0.05) obtained from the Paired T-test analysis.
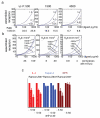
FIGURE 3. Modeling of receptor assemblage in response to varying number of second chains
A Matlab algorithm was used to calculate assemblage of IL-4 receptors on cell surfaces expressing only the Type-I IL-4 receptor. (a) IL-4Rα number was set to 1500. Second chain number was raised from 500 to 4500 and 2-dimensional equilibrium constant (Ka2) of IL-4Rα complexes for second chain were over a range from 0.01μm2 to 1μm2 as indicated. The ratio of assembled chains of highest (1.0 μm2) versus lowest (0.01 μm2) second chain Ka2 values was calculated for 100 and 1000 pg/ml at 500, 1500 and 4500 γc molecules per cell. (b) IL-4Rα number was set to 1500. 2-D equilibrium constant was varied from 1μm2 to 0.01μm2 and second chain number from 167 to 4500 per cell. Complexes assembled with 167 γc chains per cell at 100 and 1000 pg/ml of IL-4 or superkines at 2-D equilibrium constants of 1.0 μm2, 0.1 μm2 or 0.01 μm2 are shown. (c) Phosphorylation of STAT6 in Ramos and U937 cells in response to super-4, IL-4 and KFR in the presence of anti-γc antibody (0, 5, or 50 μg/ml). Response in the absence of anti-γc was normalized to 100% and responses in the presence of anti-γc expressed as in relation to the normalized value. Data (mean and SEM) are from three independent experiments.
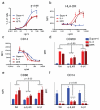
FIGURE 4. Functional activities exhibited by IL-4 and superkines
(a) Human naïve CD4+ CD45RA+ CD45RO− CD25− T cells were cultured with anti-CD3/anti-CD28-coated beads in the presence of TGF-β and the indicated concentrations of IL-4, super-4 or KFR. Cells were subsequently analyzed for intracellular expression of IL-9. Data (mean and SEM) are from 3 independent experiments with >4 donors. (b,c) CD14+ monocytes were isolated (>97% purity) from peripheral blood mononuclear cells obtained from healthy blood donors and cultured with 50 ng/mL GM-CSF alone or with the indicated concentrations of IL-4, KFR or super-4. Cells were subsequently stained with DAPI, fluorescently labeled isotype control mAbs, or mAbs against HLA-DR (b) and CD14 (c). Data (mean and SEM) are from 3 donors. (d,f) CD14+ monocytes were isolated (>97% purity) and cultured with 50 ng/mL GM-CSF and 2 μg/ml of IL-4, KFR or super-4 in the presence of the indicated antibodies. Cells were processed and subsequently stained with DAPI, fluorescently labeled isotype control mAbs, or mAbs against CD209 (d), CD86 (e) and CD14 (f). Data (mean and SEM) are from 3 donors. Paired T-test was used to determine significant changes.
FIGURE 5. Signaling and internalization kinetics of IL-4 and the two superkines in monocytes
CD14+ monocytes (>97% pure) were stimulated with 30pM of IL-4, super-4 or KFR for the indicated times. (a,b) Kinetics of STAT6 (a) and IRS1 phosphorylation (b) were measured by flow cytometry using phospho-specific antibodies coupled to fluorescence dyes. (c,d) Surface IL-13Rα1 (c) and γc internalization (d) was assayed by flow cytometry using receptor chain specific antibodies fluorescently labeled. In both cases data (mean and SEM) are from 4 healthy donors.
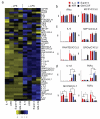
FIGURE 6. Distinct patterns of cytokine secretion induced by IL-4 and the two superkines in immature and LPS-matured DCs
Purified monocytes from 3 healthy donors were cultured for 7 days with GM-CSF (50 ng/ml) alone or combined with IL-4, KFR or super-4 (20 ng/ml), then stimulated (or not) with LPS (2 μg/ml) for another 24 hours. Culture supernatant was assessed by Luminex for relative amounts of 51 cytokines, chemokines and growth factors (listed by the heatmap (a)). (b-d) The panels on the right of the heatmap are representative examples of products whose secretion was either (b) unchanged (n=19), (c) increased by LPS stimulation only (n=20), or (d) modulated by superkines in the presence or absence of LPS (n=12). Data represent mean and SD from 3 healthy donors (normalized to GM-CSF alone group). Paired T-test was used to determine significant changes, *p<0.05).
Comment in
- Immunology: Evolving superkines for selectivity.
Miersch S, Sidhu SS. Miersch S, et al. Nat Chem Biol. 2012 Dec;8(12):955-6. doi: 10.1038/nchembio.1119. Nat Chem Biol. 2012. PMID: 23183579 No abstract available.
Similar articles
- The extracellular and transmembrane domains of the γC and interleukin (IL)-13 receptor α1 chains, not their cytoplasmic domains, dictate the nature of signaling responses to IL-4 and IL-13.
Heller NM, Qi X, Gesbert F, Keegan AD. Heller NM, et al. J Biol Chem. 2012 Sep 14;287(38):31948-61. doi: 10.1074/jbc.M112.348896. Epub 2012 Jul 24. J Biol Chem. 2012. PMID: 22829596 Free PMC article. - STAT-1 is activated by IL-4 and IL-13 in multiple cell types.
Wang IM, Lin H, Goldman SJ, Kobayashi M. Wang IM, et al. Mol Immunol. 2004 Jul;41(9):873-84. doi: 10.1016/j.molimm.2004.04.027. Mol Immunol. 2004. PMID: 15261459 - Single cell analysis reveals that IL-4 receptor/Stat6 signaling is not required for the in vivo or in vitro development of CD4+ lymphocytes with a Th2 cytokine profile.
Jankovic D, Kullberg MC, Noben-Trauth N, Caspar P, Paul WE, Sher A. Jankovic D, et al. J Immunol. 2000 Mar 15;164(6):3047-55. doi: 10.4049/jimmunol.164.6.3047. J Immunol. 2000. PMID: 10706693 - Low IL-13Rα1 expression on mast cells tunes them unresponsive to IL-13.
Salomaa T, Kummola L, González-Rodríguez MI, Hiihtola L, Järvinen TAH, Junttila IS. Salomaa T, et al. J Leukoc Biol. 2023 Jul 27;114(2):187-194. doi: 10.1093/jleuko/qiad065. J Leukoc Biol. 2023. PMID: 37224625 - Interleukin 4: signalling mechanisms and control of T cell differentiation.
Paul WE. Paul WE. Ciba Found Symp. 1997;204:208-16; discussion 216-9. doi: 10.1002/9780470515280.ch14. Ciba Found Symp. 1997. PMID: 9107423 Review.
Cited by
- Significance of Interleukin (IL)-4 and IL-13 in Inflammatory Arthritis.
Iwaszko M, Biały S, Bogunia-Kubik K. Iwaszko M, et al. Cells. 2021 Nov 3;10(11):3000. doi: 10.3390/cells10113000. Cells. 2021. PMID: 34831223 Free PMC article. Review. - Synthekines are surrogate cytokine and growth factor agonists that compel signaling through non-natural receptor dimers.
Moraga I, Spangler JB, Mendoza JL, Gakovic M, Wehrman TS, Krutzik P, Garcia KC. Moraga I, et al. Elife. 2017 May 12;6:e22882. doi: 10.7554/eLife.22882. Elife. 2017. PMID: 28498099 Free PMC article. - Extraordinary effects of unnatural pairings.
Villarino A, O'Shea JJ. Villarino A, et al. Elife. 2017 May 12;6:e27198. doi: 10.7554/eLife.27198. Elife. 2017. PMID: 28498100 Free PMC article. - A strategy for the selection of monovalent antibodies that span protein dimer interfaces.
Spangler JB, Moraga I, Jude KM, Savvides CS, Garcia KC. Spangler JB, et al. J Biol Chem. 2019 Sep 20;294(38):13876-13886. doi: 10.1074/jbc.RA119.009213. Epub 2019 Aug 6. J Biol Chem. 2019. PMID: 31387945 Free PMC article. - Strategies to therapeutically modulate cytokine action.
Leonard WJ, Lin JX. Leonard WJ, et al. Nat Rev Drug Discov. 2023 Oct;22(10):827-854. doi: 10.1038/s41573-023-00746-x. Epub 2023 Aug 4. Nat Rev Drug Discov. 2023. PMID: 37542128 Review.
References
- Leonard WJ. Type I Cytokines and Interferons and their Receptors. In: Paul W, editor. Fundamental Immunology. Lippinscott-Raven; Philadelphia: 1999. pp. 741–774.
- Ihle JN. Cytokine receptor signalling. Nature. 1995;377:591–594. - PubMed
- Stroud RM, Wells JA. Mechanistic diversity of cytokine receptor signaling across cell membranes. Sci. STKE. 2004;2004:re7. - PubMed
- Cunningham BC, et al. Dimerization of the extracellular domain of the human growth hormone receptor by a single hormone molecule. Science. 1991;254:821–825. - PubMed
Publication types
MeSH terms
Substances
Grants and funding
- T32 AI007290/AI/NIAID NIH HHS/United States
- U01-DK078123/DK/NIDDK NIH HHS/United States
- HHMI/Howard Hughes Medical Institute/United States
- R37 AI051321/AI/NIAID NIH HHS/United States
- ImNIH/Intramural NIH HHS/United States
- R01-AI51321/AI/NIAID NIH HHS/United States
- R01 CA065237/CA/NCI NIH HHS/United States
- U01 DK078123/DK/NIDDK NIH HHS/United States
- R01 AI051321/AI/NIAID NIH HHS/United States
LinkOut - more resources
Full Text Sources
Other Literature Sources
Molecular Biology Databases
Research Materials
Miscellaneous


