PtdIns4P synthesis by PI4KIIIα at the plasma membrane and its impact on plasma membrane identity - PubMed (original) (raw)
PtdIns4P synthesis by PI4KIIIα at the plasma membrane and its impact on plasma membrane identity
Fubito Nakatsu et al. J Cell Biol. 2012.
Abstract
Plasma membrane phosphatidylinositol (PI) 4-phosphate (PtdIns4P) has critical functions via both direct interactions and metabolic conversion to PI 4,5-bisphosphate (PtdIns(4,5)P₂) and other downstream metabolites. However, mechanisms that control this PtdIns4P pool in cells of higher eukaryotes remain elusive. PI4KIIIα, the enzyme thought to synthesize this PtdIns4P pool, is reported to localize in the ER, contrary to the plasma membrane localization of its yeast homologue, Stt4. In this paper, we show that PI4KIIIα was targeted to the plasma membrane as part of an evolutionarily conserved complex containing Efr3/rolling blackout, which we found was a palmitoylated peripheral membrane protein. PI4KIIIα knockout cells exhibited a profound reduction of plasma membrane PtdIns4P but surprisingly only a modest reduction of PtdIns(4,5)P₂ because of robust up-regulation of PtdIns4P 5-kinases. In these cells, however, much of the PtdIns(4,5)P₂ was localized intracellularly, rather than at the plasma membrane as in control cells, along with proteins typically restricted to this membrane, revealing a major contribution of PI4KIIIα to the definition of plasma membrane identity.
Figures
Figure 1.
Full-length PI4KIIIα visits the plasma membrane dynamically. (A) Confocal imaging of HeLa cells transfected with GFP-M1*-PI4KIIIα (left) or GFP-M1-PI4KIIIα (right). (B) Anti-PI4KIIIα Western blot comparing electrophoretic mobility of endogenous (Endog.) PI4KIIIα and either exogenously expressed M1-PI4KIIIα or M1*-PI4KIIIα in lysates of HEK cells. Molecular masses are given in kilodaltons. (C) Alignment of the N-terminal region of vertebrate PI4KIIIα orthologues. The black shading denotes conservation of amino acid identity, and the gray shading denotes conservation of amino acid similarity. (D) Ribosome footprinting reveals M1 and T*, but not M1*, as likely PI4KIIIα translation start sites. The data shown were pooled from two biological replicate experiments. (E) TIRF microscopic analysis shows highly dynamic spots of GFP-M1-PI4KIIIα, but not of GFP-M1*-PI4KIIIα, at the plasma membrane, revealing very transient visits of the enzyme to this membrane. COS-7 cells were transfected with GFP-M1-PI4KIIIα (top row) or GFP-M1*-PI4KIIIα (bottom row) and imaged by TIRF microscopy, with a 1-s interval between each image acquisition. Bars: (A) 20 µm; (E) 2 µm.
Figure 2.
PI4KIIIα, EFR3B, and TTC7B form a complex at the plasma membrane. (A) Western blot analysis of anti-EFR3B and control immunoprecipitates from mouse brain homogenates. (B) Western blot analysis of anti-GFP, anti-HA, and anti-FLAG immunoprecipitates from lysates of HeLa cells transfected with GFP-M1-PI4KIIIα, EFR3B-HA, and TTC7B-FLAG. (C) Confocal imaging of live HeLa cells transfected with TTC7B-GFP (top) or EFR3B-tdTomato (bottom). (D) Imaging analysis of HeLa cells triple transfected with GFP-M1-PI4KIIIα, TTC7B-mCherry, and EFR3B-HA. EFR3B-HA immunofluorescence was performed with an anti-HA antibody followed by an Alexa Fluor 647–conjugated anti–rat secondary antibody. (E and F) Imaging analysis of HeLa cells double transfected with EFR3B-HA and either TTC7B-mCherry (E) or GFP-M1-PI4KIIIα (F) after anti-HA immunofluorescence labeling. Insets show the region outlined with dotted lines at higher magnification. Bars: (full size images) 20 µm; (insets) 2 µm.
Figure 3.
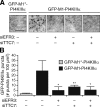
Endogenous EFR3 and TTC7 are required for recruitment of GFP-M1-PI4KIIIα to the plasma membrane. HeLa cells were treated with a negative control siRNA or siRNA against EFR3A and EFR3B (siEFR3) and TTC7A and TTC7B (siTTC7) either alone or in combination. After 24 h, the cells were transfected with GFP-M1*-PI4KIIIα or GFP-M1-PI4KIIIα, and after an additional 24 h, the cells were imaged by TIRF microscopy, with a 1-s interval in between each image acquisition. (A) Representative images for each of the samples quantified in B. (B) Quantification of the number of GFP puncta observed at the plasma membrane, normalized per unit area. Error bars indicate standard deviations. *, P < 0.005 and **, P < 0.02, relative to GFP-M1-PI4KIIIα with control siRNA (n = 4–6). Bar, 5 µm.
Figure 4.
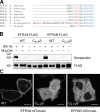
EFR3 is palmitoylated at a conserved N-terminal Cys-rich motif. (A) Alignment of N terminus of EFR3 orthologues in several species reveals a conserved Cys-rich motif. Red, Cys residues; blue, basic residues; green, hydrophobic residues. (B) EFR3A-FLAG and EFR3B-FLAG are palmitoylated at an N-terminal Cys-rich motif. Recombinant EFR3A-FLAG (wild type [WT] or C6S/C7S/C8S/C9S quadruple mutant, denoted C6–9S) or EFR3B-FLAG (wild type or C5S/C7S/C8S triple mutant, denoted C5,7,8S) were immunoprecipitated from lysates of HeLa cells metabolically labeled with alkynyl palmitate (alk-16) or vehicle and transfected with the appropriate EFR3-FLAG construct. The samples were subsequently labeled with biotin-azide using click chemistry, treated with or without hydroxylamine (NH2OH) to cleave thioester linkages, and analyzed by Western blotting, using streptavidin or anti-FLAG antibody. (C) Confocal imaging of live HeLa cells transfected with wild-type EFR3A-tdTomato, C6–9S EFR3A-tdTomato, or C5,7,8S EFR3B-tdTomato. Bars, 20 µm.
Figure 5.
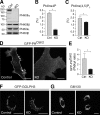
PI4KIIIα and PtdIns4P production. (A) Western blot analysis of the four PI 4-kinase isoforms in lysates from control (Ctrl) and PI4KIIIα KO MEFs. (B and C) Quantification of PtdIns4P and PtdIns(4,5)P2 (shown as a percentage of total inositol phospholipids, n = 3) in control and PI4KIIIα KO MEFs, respectively. *, P < 0.0001. (D) Imaging of the plasma membrane PtdIns4P pool in control and PI4KIIIα KO MEFs using GFP-PHOsh2. (E) Quantification of the plasma membrane/cytosol (PM/cyt) GFP-PHOsh2 fluorescence ratio in D based on line scans (control, n = 29; KO, n = 30; *, P < 0.0001). (F) Imaging of the Golgi complex PtdIns4P pool in control and PI4KIIIα KO MEFs using GFP-GOLPH3. (G) Imaging of Golgi complex morphology in control and PI4KIIIα KO MEFs using anti-GM130 immunofluorescence. Error bars indicate standard deviations. Bars, 20 µm.
Figure 6.
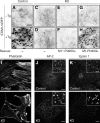
Loss of PI4KIIIα causes perturbations of PtdIns4P- and PtdIns(4,5)P2-dependent processes at the plasma membrane. (A–H) Control (A and B) and PI4KIIIα KO MEFs (C–H) were transfected with STIM1-mRFP. For rescue experiments, KO MEFs were transfected with GFP-M1*-PI4KIIIα (E and F) or GFP-M1-PI4KIIIα (G and H). Plasma membrane–associated STIM1-mRFP fluorescence was imaged by TIRF microscopy before (−Tg) or 8 min after (+Tg) the addition of 1 µm thapsigargin (Tg). (I) F-actin in control and PI4KIIIα KO MEFs as revealed by staining with fluorescently labeled phalloidin. (J and K) Altered assembly of the endocytic clathrin machinery in control and PI4KIIIα KO MEFs as assessed by immunofluorescence labeling of AP-2 (J) and epsin 1 (K). Insets show a representative region at higher magnification. Bars: (A–H) 10 µm; (I–K, full size images) 20 µm; (J and K, insets) 5 µm.
Figure 7.
Ectopic PtdIns(4,5)P2 localization and up-regulation of PIPKIs in PI4KIIIα KO MEFs. (A) Imaging of PtdIns(4,5)P2 distribution in control and PI4KIIIα KO MEFs using RFP-PHPLCδ. (inset) Note the presence of PtdIns(4,5)P2-positive vesicles only in KO MEFs. (B) Quantification of the plasma membrane/cytosol (PM/cyt) GFP-PHPLCδ fluorescence ratio in control and PI4KIIIα KO MEFs based on line scans (control, n = 22; KO, n = 23; *, P < 0.0001). (C) PIPKIγ and PtdIns(4,5)P2 colocalize on intracellular vesicles in cells lacking PI4KIIIα. PI4KIIIα KO MEFs were transfected with RFP-PHPLCδ and GFP-PIPKIγ87 and imaged by confocal microscopy. Insets show the region outlined with dotted lines at higher magnification. (D) Western blot analysis of PIPKIβ and PIPKIγ levels in control MEFs, PI4KIIIα KO MEFs, and PI4KIIIα KO MEFs transfected with GFP-M1-PI4KIIIα (KO + rescue). *, P < 0.0002 (n = 3); **, P < 0.003 (n = 3). rel., relative. (E) Actin comet tails in PI4KIIIα KO MEFs visualized by CHUtrophin-mCherry (a marker of F-actin). (F) Actin comet tail in PI4KIIIα KO MEFs double transfected with CHUtrophin-mCherry and GFP-PHPLCδ. Note the presence of a PtdIns(4,5)P2-positive vesicle at the head of the comet. (G) Acute, 488-nm light-mediated depletion of plasma membrane PtdIns(4,5)P2 from HeLa cells (see Materials and methods for details) results in diffuse intracellular fluorescence of the PtdIns(4,5)P2 probe iRFP-PHPLCδ but no detectable PtdIns(4,5)P2-positive intracellular vesicles. (H) Chronic depletion of plasma membrane PtdIns(4,5)P2 from HeLa cells by transfection with a membrane-anchored inositol 5-phosphatase (mRFP-IPP1-CAAX; see cell on the right) results in diffuse intracellular fluorescence of the PtdIns(4,5)P2 probe iRFP-PHPLCδ, but no PtdIns(4,5)P2-positive intracellular vesicles are apparent 16 h after transfection. Note that the myristoylated/palmitoylated plasma membrane marker L10-GFP is retained at the plasma membrane. Ctrl, control. Error bars indicate standard deviations. Bars: (A [inset], C [inset], E, and F) 5 µm; (H) 10 µm; (A [full size], C [full size], and G) 20 µm.
Figure 8.
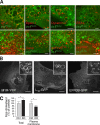
Loss of plasma membrane identity in PI4KIIIα KO MEFs. Proteins typically restricted to the plasma membrane are found on intracellular PtdIns(4,5)P2-positive vesicles, which are negative for a variety of endosomal and Golgi markers. (A) PtdIns(4,5)P2-positive intracellular vesicles, visualized with GFP- or RFP-PHPLCδ, colocalize with endocytic clathrin machinery components (endogenous AP-2, epsin 1, and dynamin 2–GFP) but not with markers of endosomes (endogenous EEA1, GFP-Rab5, and GFP-Rab9), the endosomal phosphoinositide PtdIns3P (GFP-2×FYVEHrs), and Golgi-localized PtdIns4P (GFP-PHOSBP). For clarity, PHPLCδ is false colored green, and the second marker is false colored red in all images. (B) Mislocalization of plasma membrane proteins in cells lacking PI4KIIIα. PI4KIIIα KO MEFs were transfected with M1R-YFP, L10-GFP, or EFR3B-GFP and imaged by confocal microscopy. Note the accumulation of all markers in intracellular vesicles highlighted in the inset images. (C) Measurement of total and plasma membrane fraction of free cholesterol in control and PI4KIIIα KO MEFs. Total free cholesterol levels were measured by HPLC, after lipid extraction, and normalized to total cellular phospholipid levels. *, P < 0.0001 (n = 12 for control and KO). Plasma membrane free cholesterol was measured by treatment of cells with 10 mM MβCD for 1 min followed by quantification of extracted cholesterol using an enzyme-coupled assay and normalization to total protein content. Error bars indicate standard deviations. *, P < 0.02 (n = 6 for control and KO). Bars: (A and B, insets) 5 µm; (B, full size images) 20 µm.
Similar articles
- Plasticity of PI4KIIIα interactions at the plasma membrane.
Chung J, Nakatsu F, Baskin JM, De Camilli P. Chung J, et al. EMBO Rep. 2015 Mar;16(3):312-20. doi: 10.15252/embr.201439151. Epub 2015 Jan 21. EMBO Rep. 2015. PMID: 25608530 Free PMC article. - PI4KIIIα is required for cortical integrity and cell polarity during Drosophila oogenesis.
Tan J, Oh K, Burgess J, Hipfner DR, Brill JA. Tan J, et al. J Cell Sci. 2014 Mar 1;127(Pt 5):954-66. doi: 10.1242/jcs.129031. Epub 2014 Jan 10. J Cell Sci. 2014. PMID: 24413170 - A PI4KIIIα protein complex is required for cell viability during Drosophila wing development.
Basu U, Balakrishnan SS, Janardan V, Raghu P. Basu U, et al. Dev Biol. 2020 Jun 15;462(2):208-222. doi: 10.1016/j.ydbio.2020.03.008. Epub 2020 Mar 17. Dev Biol. 2020. PMID: 32194035 Free PMC article. - Lipid kinases: charging PtdIns(4,5)P2 synthesis.
Divecha N. Divecha N. Curr Biol. 2010 Feb 23;20(4):R154-7. doi: 10.1016/j.cub.2010.01.016. Curr Biol. 2010. PMID: 20178759 Review. - Phosphatidylinositol Kinases and Phosphatases in Entamoeba histolytica.
Nakada-Tsukui K, Watanabe N, Maehama T, Nozaki T. Nakada-Tsukui K, et al. Front Cell Infect Microbiol. 2019 Jun 6;9:150. doi: 10.3389/fcimb.2019.00150. eCollection 2019. Front Cell Infect Microbiol. 2019. PMID: 31245297 Free PMC article. Review.
Cited by
- Sac2/INPP5F is an inositol 4-phosphatase that functions in the endocytic pathway.
Nakatsu F, Messa M, Nández R, Czapla H, Zou Y, Strittmatter SM, De Camilli P. Nakatsu F, et al. J Cell Biol. 2015 Apr 13;209(1):85-95. doi: 10.1083/jcb.201409064. J Cell Biol. 2015. PMID: 25869668 Free PMC article. - Emerging roles of phosphatidylinositol 4-phosphate and phosphatidylinositol 4,5-bisphosphate as regulators of multiple steps in autophagy.
Baba T, Balla T. Baba T, et al. J Biochem. 2020 Oct 1;168(4):329-336. doi: 10.1093/jb/mvaa089. J Biochem. 2020. PMID: 32745205 Free PMC article. Review. - A large scale high-throughput screen identifies chemical inhibitors of phosphatidylinositol 4-kinase type II alpha.
Sengupta N, Jović M, Barnaeva E, Kim DW, Hu X, Southall N, Dejmek M, Mejdrova I, Nencka R, Baumlova A, Chalupska D, Boura E, Ferrer M, Marugan J, Balla T. Sengupta N, et al. J Lipid Res. 2019 Mar;60(3):683-693. doi: 10.1194/jlr.D090159. Epub 2019 Jan 9. J Lipid Res. 2019. PMID: 30626625 Free PMC article. - Dishevelled coordinates phosphoinositide kinases PI4KIIIα and PIP5KIγ for efficient PtdInsP2 synthesis.
de la Cruz L, Riquelme R, Vivas O, Barria A, Jensen JB. de la Cruz L, et al. J Cell Sci. 2022 Mar 1;135(5):jcs259145. doi: 10.1242/jcs.259145. Epub 2022 Feb 3. J Cell Sci. 2022. PMID: 34982154 Free PMC article. - Postnatal Development and Maintenance of Functional Pituitary Gonadotrophs Is Dependent on PI4-Kinase A.
Constantin S, Sokanovic SJ, Mochimaru Y, Smiljanic K, Sivcev S, Prévide RM, Wray S, Balla T, Stojilkovic SS. Constantin S, et al. Endocrinology. 2023 Nov 2;164(12):bqad168. doi: 10.1210/endocr/bqad168. Endocrinology. 2023. PMID: 37935042 Free PMC article.
References
Publication types
MeSH terms
Substances
Grants and funding
- T32 GM007223/GM/NIGMS NIH HHS/United States
- DK075772/DK/NIDDK NIH HHS/United States
- K01 DK078625/DK/NIDDK NIH HHS/United States
- R01 DK075772/DK/NIDDK NIH HHS/United States
- P30 DA018343/DA/NIDA NIH HHS/United States
- DK45735/DK/NIDDK NIH HHS/United States
- DK082700/DK/NIDDK NIH HHS/United States
- T32GM007223/GM/NIGMS NIH HHS/United States
- R37NS036251/NS/NINDS NIH HHS/United States
- R37 NS036251/NS/NINDS NIH HHS/United States
- R01 DK082700/DK/NIDDK NIH HHS/United States
- P30 DK045735/DK/NIDDK NIH HHS/United States
- DK078625/DK/NIDDK NIH HHS/United States
- DA018343/DA/NIDA NIH HHS/United States
LinkOut - more resources
Full Text Sources
Other Literature Sources
Molecular Biology Databases
Research Materials
Miscellaneous


