Fingolimod reduces cerebral lymphocyte infiltration in experimental models of rodent intracerebral hemorrhage - PubMed (original) (raw)
Fingolimod reduces cerebral lymphocyte infiltration in experimental models of rodent intracerebral hemorrhage
William B Rolland et al. Exp Neurol. 2013 Mar.
Abstract
T-lymphocytes promote cerebral inflammation, thus aggravating neuronal injury after stroke. Fingolimod, a sphingosine 1-phosphate receptor analog, prevents the egress of lymphocytes from primary and secondary lymphoid organs. Based on these findings, we hypothesized fingolimod treatment would reduce the number of T-lymphocytes migrating into the brain, thereby ameliorating cerebral inflammation following experimental intracerebral hemorrhage (ICH). We investigated the effects of fingolimod in two well-established murine models of ICH, implementing intrastriatal infusions of either bacterial collagenase (cICH) or autologous blood (bICH). Furthermore, we tested the long term neurological improvements by Fingolimod in a collagenase-induced rat model of ICH. Fingolimod, in contrast to vehicle administration alone, improved neurological functions and reduced brain edema at 24 and 72 h following experimental ICH in CD-1 mice (n=103; p<0.05). Significantly fewer lymphocytes were found in blood and brain samples of treated animals when compared to the vehicle group (p<0.05). Moreover, fingolimod treatment significantly reduced the expression of intercellular adhesion molecule-1 (ICAM-1), interferon-γ (INF-γ), and interleukin-17 (IL-17) in the mouse brain at 72 h post-cICH (p<0.05 compared to vehicle). Long-term neurocognitive performance and histopathological analysis were evaluated in Sprague-Dawley rats between 8 and 10 weeks post-cICH (n=28). Treated rats showed reduced spatial and motor learning deficits, along with significantly reduced brain atrophy and neuronal cell loss within the basal ganglia (p<0.05 compared to vehicle). We conclude that fingolimod treatment ameliorated cerebral inflammation, at least to some extent, by reducing the availability and subsequent brain infiltration of T-lymphocytes, which improved the short and long-term sequelae after experimental ICH in rodents.
Copyright © 2012 Elsevier Inc. All rights reserved.
Figures
Figure 1
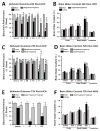
Effects of single fingolimod treatment on behavioral performances (A) and brain edema (B) at 24 hours after collagenase-induced intracerebral hemorrhage (cICH). Effects of single and daily fingolimod treatments on behavioral performances (C) and brain edema (D) at 72 hours after cICH. Effects of daily fingolimod treatment on behavioral performances (E) and brain edema (F) at 72 hours after intrastriatal blood infusion (bICH). Behavior data are expressed as mean percentage of sham values ± SEM. Brain edema values are expressed as mean ± SEM. N=7 mice per group. * p<0.05 compared to sham, † p<0.05 compared to vehicle. Contra: contralateral, Ipsi: ipsilateral, Garcia: Garcia Neuroscore, WH: wire hang test, BB: beam balance test, FUA: forelimb use asymmetry test, CT: corner test, PP: paw placement test.
Figure 2
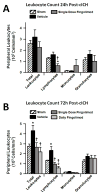
Effects of single fingolimod treatment on peripheral blood leukocyte counts at 24 hours (A) and effects of single and daily fingolimod treatments on peripheral blood leukocyte counts at 72 hours (B) after cICH in mice. Values are expressed as mean ± SEM. N=7 mice per group. * p<0.05 compared to sham, † p<0.05 compared to vehicle.
Figure 3
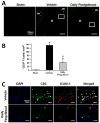
Effect of daily fingolimod treatment on brain infiltration of T-lymphocytes at 72 hours after cICH-induction or sham surgery in mice (A). Representative photomicrographs showing CD3 positive cells (arrow heads) infiltrating the perihematomal (PH) area, and to a lesser extent the hemorrhage (H) site. White box depicts the area magnified below. Bar graph showing CD3 positive cell quantification (B). Representative photomicrographs showing CD3 positive cells (green) with ICAM-1 (red) co-localization. DAPI nucleic acid stain (blue) marked DNA (C). Data in bar graphs are expressed as mean ± SEM. N=5 mice per group. * p<0.05 compared to sham, † p<0.05 compared to vehicle.
Figure 4
Representative Western blots (A) and bar graphs showing densitometric quantifications of the inflammatory markers interferon gamma (IFN-γ) (B), inter-cellular adhesion molecule-1 (ICAM-1) (C), and interleukin 17 (IL-17) (D) at 72 hours after cICH-induction or sham surgery. The band density values were calculated as a ratio of β-actin, normalized to sham. Data are expressed as mean fold change ± SEM. N=6 mice per group.* p<0.05 compared to sham, † p<0.05 compared to vehicle.
Figure 5
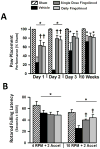
Effects of single or daily fingolimod treatment on behavioral performances of the paw placement test at 1, 2, and 3 days and at 10 weeks after cICH-induction or sham surgery in rats (A). Effects of single or daily fingolimod treatment on rotarod performances at 8 weeks after cICH-induction or sham surgery in rats (B). Behavior data of the paw placement test are expressed as mean percentage of sham values ± SEM. Behavior data of the rotarod performance are expressed as mean ± SEM. N=7 rats per group. * p<0.05 compared to sham, † p<0.05 compared to vehicle.
Figure 6
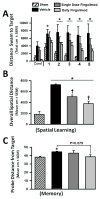
Effects of single or daily fingolimod treatment on cognitive performance during the water maze test at 8 weeks after cICH-induction or sham surgery in rats. Bar graph showing the distances swam before finding the submerged platform for each the 5 blocks of daily trials (A). Bar graph showing the overall average distance swam before finding the submerged platform (B). Bar graph showing the average proximity to the previous target location during the probe trials (C). Values are expressed as mean ± SEM. N=7 rats per group.* p<0.05 compared to sham, † p<0.05 compared to vehicle.
Figure 7
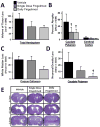
Effects of single or daily fingolimod treatment on cerebral histopathology at 10 weeks after cICH-induction in rats. Bar graph showing total tissue loss of the ipsilateral brain hemisphere (A). Bar graph showing percent atrophy of the caudate putamen and cerebral cortex based on the volumetric difference of the contralateral side (B). Bar graph showing white-matter loss measured as percent volumetric difference of the corpus callosum between the ipsilateral and contralateral hemispheres (C). Bar graph depicting loss of neuronal density in the ipsilateral caudate putamen reported as the difference in cell counts between ipsilateral and contralateral regions (D). Representative microphotographs of Nissl stained brain sections illustrating ventriculomegaly at 10 weeks following cICH-induction (E). Values are expressed as mean ± SEM. N=7 rats per group. † p<0.05 compared to vehicle.
Similar articles
- FTY720 is neuroprotective and improves functional outcomes after intracerebral hemorrhage in mice.
Rolland WB 2nd, Manaenko A, Lekic T, Hasegawa Y, Ostrowski R, Tang J, Zhang JH. Rolland WB 2nd, et al. Acta Neurochir Suppl. 2011;111:213-7. doi: 10.1007/978-3-7091-0693-8_36. Acta Neurochir Suppl. 2011. PMID: 21725758 Free PMC article. - Fingolimod exerts neuroprotective effects in a mouse model of intracerebral hemorrhage.
Lu L, Barfejani AH, Qin T, Dong Q, Ayata C, Waeber C. Lu L, et al. Brain Res. 2014 Mar 25;1555:89-96. doi: 10.1016/j.brainres.2014.01.048. Epub 2014 Feb 3. Brain Res. 2014. PMID: 24502984 Free PMC article. - Fingolimod provides long-term protection in rodent models of cerebral ischemia.
Wei Y, Yemisci M, Kim HH, Yung LM, Shin HK, Hwang SK, Guo S, Qin T, Alsharif N, Brinkmann V, Liao JK, Lo EH, Waeber C. Wei Y, et al. Ann Neurol. 2011 Jan;69(1):119-29. doi: 10.1002/ana.22186. Epub 2010 Nov 12. Ann Neurol. 2011. PMID: 21280082 Free PMC article. - Fingolimod: a review of its use in the management of relapsing-remitting multiple sclerosis.
Scott LJ. Scott LJ. CNS Drugs. 2011 Aug;25(8):673-98. doi: 10.2165/11207350-000000000-00000. CNS Drugs. 2011. PMID: 21790210 Review. - Clinical immunology of the sphingosine 1-phosphate receptor modulator fingolimod (FTY720) in multiple sclerosis.
Mehling M, Johnson TA, Antel J, Kappos L, Bar-Or A. Mehling M, et al. Neurology. 2011 Feb 22;76(8 Suppl 3):S20-7. doi: 10.1212/WNL.0b013e31820db341. Neurology. 2011. PMID: 21339487 Review.
Cited by
- Critical Role of the Sphingolipid Pathway in Stroke: a Review of Current Utility and Potential Therapeutic Targets.
Sun N, Keep RF, Hua Y, Xi G. Sun N, et al. Transl Stroke Res. 2016 Oct;7(5):420-38. doi: 10.1007/s12975-016-0477-3. Epub 2016 Jun 24. Transl Stroke Res. 2016. PMID: 27339463 Free PMC article. Review. - Neutrophil-to-Lymphocyte Ratio Is an Independent Predictor of 30-Day Mortality of Intracerebral Hemorrhage Patients: a Validation Cohort Study.
Wang F, Wang L, Jiang TT, Xia JJ, Xu F, Shen LJ, Kang WH, Ding Y, Mei LX, Ju XF, Hu SY, Wu X. Wang F, et al. Neurotox Res. 2018 Oct;34(3):347-352. doi: 10.1007/s12640-018-9890-6. Epub 2018 Mar 28. Neurotox Res. 2018. PMID: 29594812 Free PMC article. - Sphingosine-1-phosphate Signalling in Aneurysmal Subarachnoid Haemorrhage: Basic Science to Clinical Translation.
Gaastra B, Zhang J, Tapper W, Bulters D, Galea I. Gaastra B, et al. Transl Stroke Res. 2024 Apr;15(2):352-363. doi: 10.1007/s12975-023-01133-9. Epub 2023 Feb 7. Transl Stroke Res. 2024. PMID: 36749550 Free PMC article. Review. - Neuroinflammation as a target for treatment of stroke using mesenchymal stem cells and extracellular vesicles.
Dabrowska S, Andrzejewska A, Lukomska B, Janowski M. Dabrowska S, et al. J Neuroinflammation. 2019 Sep 12;16(1):178. doi: 10.1186/s12974-019-1571-8. J Neuroinflammation. 2019. PMID: 31514749 Free PMC article. Review. - Molecular Pharmacology and Novel Potential Therapeutic Applications of Fingolimod.
Pournajaf S, Dargahi L, Javan M, Pourgholami MH. Pournajaf S, et al. Front Pharmacol. 2022 Feb 16;13:807639. doi: 10.3389/fphar.2022.807639. eCollection 2022. Front Pharmacol. 2022. PMID: 35250559 Free PMC article. Review.
References
- Aronowski J, Hall CE. New horizons for primary intracerebral hemorrhage treatment: experience from preclinical studies. Neurol Res. 2005;27:268–279. - PubMed
- Bhatia KP, Marsden CD. The behavioural and motor consequences of focal lesions of the basal ganglia in man. Brain. 1994;117(Pt 4):859–876. - PubMed
- Brinkmann V, Cyster JG, et al. FTY720: sphingosine 1-phosphate receptor-1 in the control of lymphocyte egress and endothelial barrier function. Am J Transplant. 2004;4:1019–1025. - PubMed
- Brinkmann V, Davis MD, et al. The immune modulator FTY720 targets sphingosine 1-phosphate receptors. J Biol Chem. 2002;277:21453–21457. - PubMed
Publication types
MeSH terms
Substances
LinkOut - more resources
Full Text Sources
Other Literature Sources
Miscellaneous
