Helicobacter pylori infection impairs the mucin production rate and turnover in the murine gastric mucosa - PubMed (original) (raw)
Helicobacter pylori infection impairs the mucin production rate and turnover in the murine gastric mucosa
Nazanin Navabi et al. Infect Immun. 2013 Mar.
Abstract
To protect the surface of the stomach, the epithelial cells secrete a mucus layer, which is mainly comprised of the MUC5AC mucin. Further protection is provided by a thick glycocalyx on the apical surface of the epithelial cell, with the cell surface mucin MUC1 as a major component. Here, we investigate the production rate and turnover of newly synthesized mucin in mice and analyze the effects of early colonization and chronic infection with H. pylori. Metabolic incorporation of an azido GalNAc analog (GalNAz) was used as a nonradioactive method to perform pulse experiments in the whole animal. First, the subcellular movement of newly synthesized mucin and mucin turnover was determined in uninfected mice. Based on the time line for mucin transport and dissemination, 2, 6, and 12 h after GalNAz injection was selected to collect the stomachs from mice infected with H. pylori strain SS1 during early colonization (7 days) and chronic infection (90 days). The results demonstrated that the speed from the start of glycosylation to the final destination is faster for the membrane-bound mucin to reach the glycocalyx (2 h) than for the secretory mucins to become secreted into the mucus layer (5 h). Furthermore, infection with H. pylori reduces the rate of mucin turnover and decreases the levels of Muc1. Since H. pylori colonizes this mucus niche, the decreased turnover rate indicates that H. pylori creates a more stable and favorable environment for itself by impairing the defense mechanism for clearing the mucosal surface of pathogens by mucus flow.
Figures
Fig 1
Confocal images of stomach sections from uninfected mice injected intraperitoneally with GalNAz. (A to F) The sections were collected every hour during a 12-h time course. A TAMRA-conjugated reagent was used for detecting GalNAz incorporated into newly synthesized mucin (visualized in the red channel). The 45M1 antibody was used to stain for Muc5ac (visualized in the green channel) and 4′,6-diamidino-2-phenylindole (DAPI) for nuclear DNA (visualized in the blue channel). Colocalization of Muc5ac and incorporated GalNAz (green and red) appears yellow in the images. (G) Schematic picture of the cellular localization and transfer of newly synthesized mucin. The rate of mucin transfer through the cells to the mucus layer varied slightly between cells, and in the schematic picture the average surface epithelial cell of noninfected mice is depicted.
Fig 2
GalNAz is incorporated into the glycocalyx 2 h after GalNAz injection. (A) Close-up confocal image of the surface mucus cells of a section from an uninfected mouse; red arrows denote GalNAz in the glycocalyx, which is visualized as red. White arrows point at the black holes where the nucleus is present (DAPI was not used to show the nucleus here, as the broad spectra from DAPI poses a risk for spillover of signal into the red channel). (B) Schematic picture of newly synthesized mucin in the glycocalyx and supranuclear area of gastric mucus-producing epithelium in noninfected mice. At this time point there was a clear gap between the GalNAz in the lower cytoplasmic area and the GalNAz in the glycocalyx. (C) Close-up confocal image of Muc5ac staining in a gastric section from an uninfected mouse, visualized as green. (D) Close-up confocal image of newly synthesized mucin in the same gastric section as that shown in panel C, visualized in red. (E) Immunostaining of Muc5ac (brown) in the antrum of a noninfected mouse. The line indicates secreted Muc5ac, and arrows denote intracellular Muc5ac. (F) Confocal images of H. pylori in an antral crypt from a mouse 7 days postinfection. H. pylori is visualized as white, Muc5ac as green. Arrows denote H. pylori.
Fig 3
Gastritis scores and CFU counts from mouse stomachs infected with H. pylori. Gastric scores of antrum (A) and corpus (B) of mice during early colonization and chronic H. pylori infection (***, P < 0.001 compared to control by ANOVA with Dunnett's post hoc test). (C) H. pylori CFU counts from stomachs of infected mice (no significant difference; two-tailed t test).
Fig 4
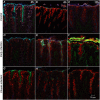
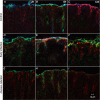
Confocal images of antrum from uninfected and H. pylori-infected mice. Uninfected mice (A to C), mice during early infection (D to F), and chronic H. pylori infection (G to I) 2, 6, and 12 h, respectively, after intraperitoneal GalNAz injection. Newly synthesized mucin (incorporated GalNAz) is visualized as red, Muc5ac as green, and Muc1 as blue. Colocalization of green and blue results in gray, whereas colocalization of green and red results in yellow.
Fig 5
Schematic picture of cellular localization and transfer of newly synthesized mucin during infection. Mucin transfer is depicted on an average surface epithelial cell of noninfected mice and compared to those of mice with early and chronic infection in antrum and corpus.
Fig 6
Quantification of Muc1 and Muc5ac during early and chronic H. pylori infection. Comparison of the integrated density of fluorescence as a measure of Muc1 in antrum (A) and corpus (B), as well as Muc5ac in antrum (C) and corpus (D). Data were compared to the control (n = 6) by ANOVA with Dunnett's post hoc test (**, P < 0.01; NS, not significant).
Fig 7
Confocal images of corpus from uninfected and H. pylori-infected mice. Uninfected mice (A to C) and mice during early H. pylori colonization (D to F) and chronic H. pylori infection (G to I) 2, 6, and 12 h, respectively, after intraperitoneal GalNAz injection. Newly synthesized mucin (incorporated GalNAz) is visualized as red, Muc5ac as green, and Muc1 as blue. Colocalization of green and blue results in gray, whereas colocalization of green and red results in yellow.
Similar articles
- Muc1 mucin limits both Helicobacter pylori colonization of the murine gastric mucosa and associated gastritis.
McGuckin MA, Every AL, Skene CD, Linden SK, Chionh YT, Swierczak A, McAuley J, Harbour S, Kaparakis M, Ferrero R, Sutton P. McGuckin MA, et al. Gastroenterology. 2007 Oct;133(4):1210-8. doi: 10.1053/j.gastro.2007.07.003. Epub 2007 Jul 10. Gastroenterology. 2007. PMID: 17919495 - Muc5ac gastric mucin glycosylation is shaped by FUT2 activity and functionally impacts Helicobacter pylori binding.
Magalhães A, Rossez Y, Robbe-Masselot C, Maes E, Gomes J, Shevtsova A, Bugaytsova J, Borén T, Reis CA. Magalhães A, et al. Sci Rep. 2016 May 10;6:25575. doi: 10.1038/srep25575. Sci Rep. 2016. PMID: 27161092 Free PMC article. - Human gastric mucins differently regulate Helicobacter pylori proliferation, gene expression and interactions with host cells.
Skoog EC, Sjöling Å, Navabi N, Holgersson J, Lundin SB, Lindén SK. Skoog EC, et al. PLoS One. 2012;7(5):e36378. doi: 10.1371/journal.pone.0036378. Epub 2012 May 1. PLoS One. 2012. PMID: 22563496 Free PMC article. - [The role of gastric mucins in interactions with Helicobacter pylori].
Radziejewska I. Radziejewska I. Postepy Hig Med Dosw (Online). 2012 Jan 30;66:60-6. Postepy Hig Med Dosw (Online). 2012. PMID: 22371407 Review. Polish. - Helicobacter pylori and gastric mucin expression: A systematic review and meta-analysis.
Niv Y. Niv Y. World J Gastroenterol. 2015 Aug 21;21(31):9430-6. doi: 10.3748/wjg.v21.i31.9430. World J Gastroenterol. 2015. PMID: 26309370 Free PMC article. Review.
Cited by
- Helicobacter pylori and gastrointestinal and neurological diseases: Study protocol of an umbrella review of systematic reviews and meta-analyses.
Wang B, Zhang J, Chen S, Bie M. Wang B, et al. Medicine (Baltimore). 2019 Dec;98(52):e18460. doi: 10.1097/MD.0000000000018460. Medicine (Baltimore). 2019. PMID: 31876728 Free PMC article. - Mucus-Pathogen Interactions in the Gastrointestinal Tract of Farmed Animals.
Quintana-Hayashi MP, Padra M, Padra JT, Benktander J, Lindén SK. Quintana-Hayashi MP, et al. Microorganisms. 2018 Jun 18;6(2):55. doi: 10.3390/microorganisms6020055. Microorganisms. 2018. PMID: 29912166 Free PMC article. Review. - Dynamic changes in mucus thickness and ion secretion during Citrobacter rodentium infection and clearance.
Gustafsson JK, Navabi N, Rodriguez-Piñeiro AM, Alomran AH, Premaratne P, Fernandez HR, Banerjee D, Sjövall H, Hansson GC, Lindén SK. Gustafsson JK, et al. PLoS One. 2013 Dec 30;8(12):e84430. doi: 10.1371/journal.pone.0084430. eCollection 2013. PLoS One. 2013. PMID: 24386378 Free PMC article. - Interleukin 4 induces rapid mucin transport, increases mucus thickness and quality and decreases colitis and Citrobacter rodentium in contact with epithelial cells.
Sharba S, Navabi N, Padra M, Persson JA, Quintana-Hayashi MP, Gustafsson JK, Szeponik L, Venkatakrishnan V, Sjöling Å, Nilsson S, Quiding-Järbrink M, Johansson MEV, Linden SK. Sharba S, et al. Virulence. 2019 Dec;10(1):97-117. doi: 10.1080/21505594.2019.1573050. Virulence. 2019. PMID: 30665337 Free PMC article. - Helicobacter hepaticus increases intestinal injury in a rat model of necrotizing enterocolitis.
Dvorak K, Coursodon-Boyiddle CF, Snarrenberg CL, Kananurak A, Underwood MA, Dvorak B. Dvorak K, et al. Am J Physiol Gastrointest Liver Physiol. 2013 Oct 15;305(8):G585-92. doi: 10.1152/ajpgi.00483.2012. Epub 2013 Aug 29. Am J Physiol Gastrointest Liver Physiol. 2013. PMID: 23989006 Free PMC article.
References
- Falush D, Wirth T, Linz B, Pritchard JK, Stephens M, Kidd M, Blaser MJ, Graham DY, Vacher S, Perez-Perez GI, Yamaoka Y, Megraud F, Otto K, Reichard U, Katzowitsch E, Wang X, Achtman M, Suerbaum S. 2003. Traces of human migrations in Helicobacter pylori populations. Science 299:1582–1585 - PubMed
- Atherton JC. 2006. The pathogenesis of Helicobacter pylori-induced gastro-duodenal diseases. Annu. Rev. Pathol. 1:63–96 - PubMed
- Lacunza E, Bara J, Segal-Eiras A, Croce MV. 2009. Expression of conserved mucin domains by epithelial tissues in various mammalian species. Res. Vet. Sci. 86:68–77 - PubMed
- Kim YS, Gum JR., Jr 1995. Diversity of mucin genes, structure, function, and expression. Gastroenterology 109:999–1001 - PubMed
Publication types
MeSH terms
Substances
LinkOut - more resources
Full Text Sources
Medical
Research Materials
Miscellaneous


